Mexican vs Navajo Bachelor's Degree
COMPARE
Mexican
Navajo
Bachelor's Degree
Bachelor's Degree Comparison
Mexicans
Navajo
27.1%
BACHELOR'S DEGREE
0.0/ 100
METRIC RATING
333rd/ 347
METRIC RANK
23.6%
BACHELOR'S DEGREE
0.0/ 100
METRIC RATING
344th/ 347
METRIC RANK
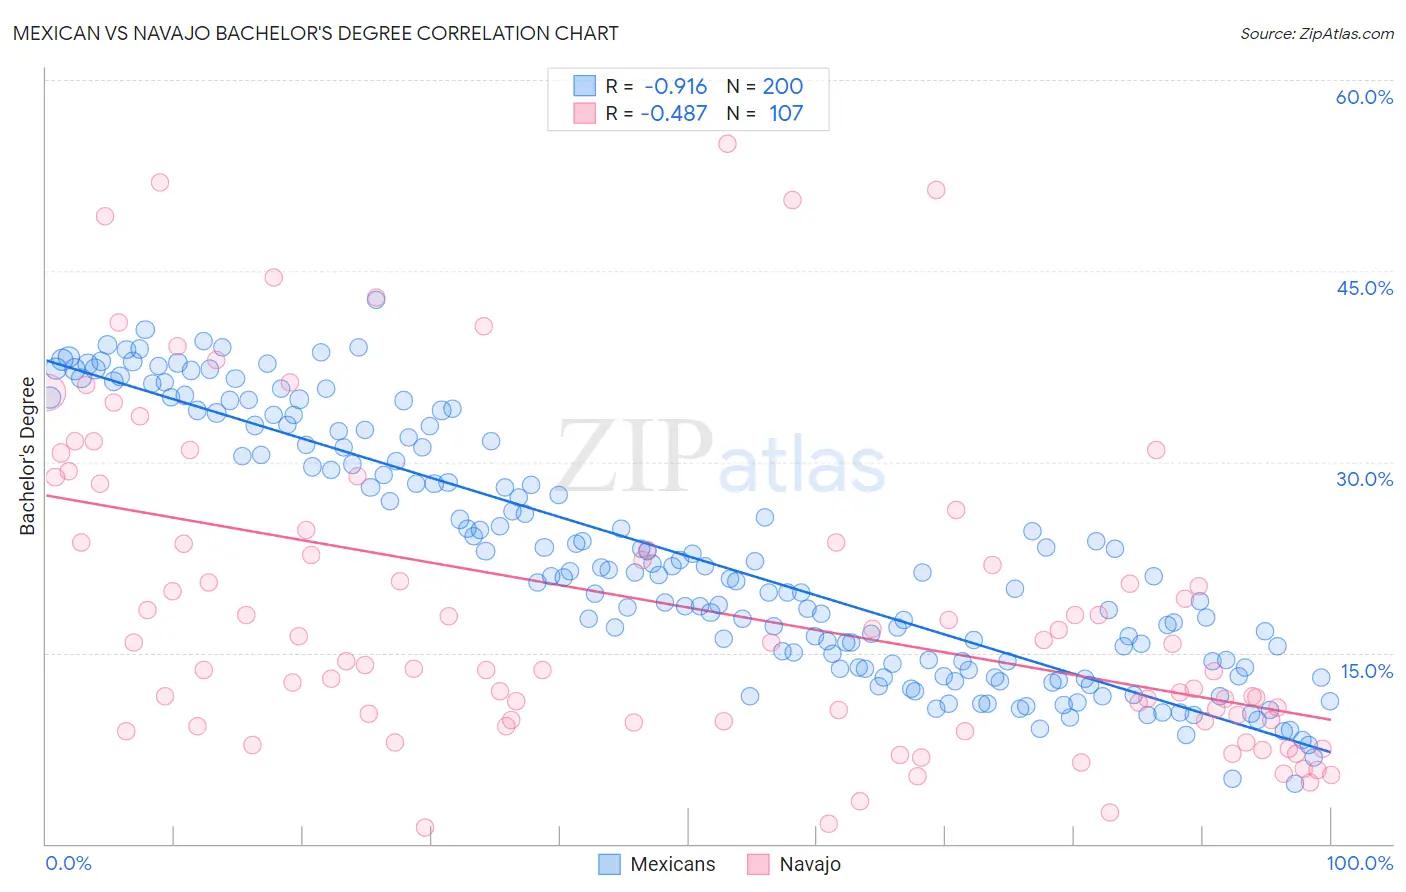
Mexican vs Navajo Bachelor's Degree Correlation Chart
The statistical analysis conducted on geographies consisting of 565,096,566 people shows a near-perfect negative correlation between the proportion of Mexicans and percentage of population with at least bachelor's degree education in the United States with a correlation coefficient (R) of -0.916 and weighted average of 27.1%. Similarly, the statistical analysis conducted on geographies consisting of 224,864,569 people shows a moderate negative correlation between the proportion of Navajo and percentage of population with at least bachelor's degree education in the United States with a correlation coefficient (R) of -0.487 and weighted average of 23.6%, a difference of 14.6%.
Bachelor's Degree Correlation Summary
| Measurement | Mexican | Navajo |
| Minimum | 4.7% | 1.3% |
| Maximum | 42.7% | 54.9% |
| Range | 38.0% | 53.6% |
| Mean | 22.6% | 18.7% |
| Median | 21.0% | 14.3% |
| Interquartile 25% (IQ1) | 14.2% | 9.6% |
| Interquartile 75% (IQ3) | 31.5% | 24.7% |
| Interquartile Range (IQR) | 17.2% | 15.1% |
| Standard Deviation (Sample) | 9.7% | 12.6% |
| Standard Deviation (Population) | 9.7% | 12.5% |
Demographics Similar to Mexicans and Navajo by Bachelor's Degree
In terms of bachelor's degree, the demographic groups most similar to Mexicans are Menominee (27.3%, a difference of 0.82%), Immigrants from the Azores (27.3%, a difference of 0.92%), Spanish American Indian (27.5%, a difference of 1.4%), Immigrants from Central America (27.5%, a difference of 1.5%), and Arapaho (26.6%, a difference of 1.7%). Similarly, the demographic groups most similar to Navajo are Pima (23.2%, a difference of 1.8%), Tohono O'odham (24.4%, a difference of 3.4%), Yakama (24.5%, a difference of 3.6%), Yuman (24.5%, a difference of 3.9%), and Lumbee (24.8%, a difference of 4.8%).
| Demographics | Rating | Rank | Bachelor's Degree |
| Crow | 0.0 /100 | #328 | Tragic 27.7% |
| Immigrants | Central America | 0.0 /100 | #329 | Tragic 27.5% |
| Spanish American Indians | 0.0 /100 | #330 | Tragic 27.5% |
| Immigrants | Azores | 0.0 /100 | #331 | Tragic 27.3% |
| Menominee | 0.0 /100 | #332 | Tragic 27.3% |
| Mexicans | 0.0 /100 | #333 | Tragic 27.1% |
| Arapaho | 0.0 /100 | #334 | Tragic 26.6% |
| Natives/Alaskans | 0.0 /100 | #335 | Tragic 26.3% |
| Immigrants | Mexico | 0.0 /100 | #336 | Tragic 26.1% |
| Inupiat | 0.0 /100 | #337 | Tragic 25.8% |
| Pueblo | 0.0 /100 | #338 | Tragic 25.5% |
| Hopi | 0.0 /100 | #339 | Tragic 25.3% |
| Lumbee | 0.0 /100 | #340 | Tragic 24.8% |
| Yuman | 0.0 /100 | #341 | Tragic 24.5% |
| Yakama | 0.0 /100 | #342 | Tragic 24.5% |
| Tohono O'odham | 0.0 /100 | #343 | Tragic 24.4% |
| Navajo | 0.0 /100 | #344 | Tragic 23.6% |
| Pima | 0.0 /100 | #345 | Tragic 23.2% |
| Houma | 0.0 /100 | #346 | Tragic 21.4% |
| Yup'ik | 0.0 /100 | #347 | Tragic 19.4% |