Chinese vs Immigrants from Micronesia Bachelor's Degree
COMPARE
Chinese
Immigrants from Micronesia
Bachelor's Degree
Bachelor's Degree Comparison
Chinese
Immigrants from Micronesia
38.5%
BACHELOR'S DEGREE
66.6/ 100
METRIC RATING
159th/ 347
METRIC RANK
30.4%
BACHELOR'S DEGREE
0.0/ 100
METRIC RATING
300th/ 347
METRIC RANK
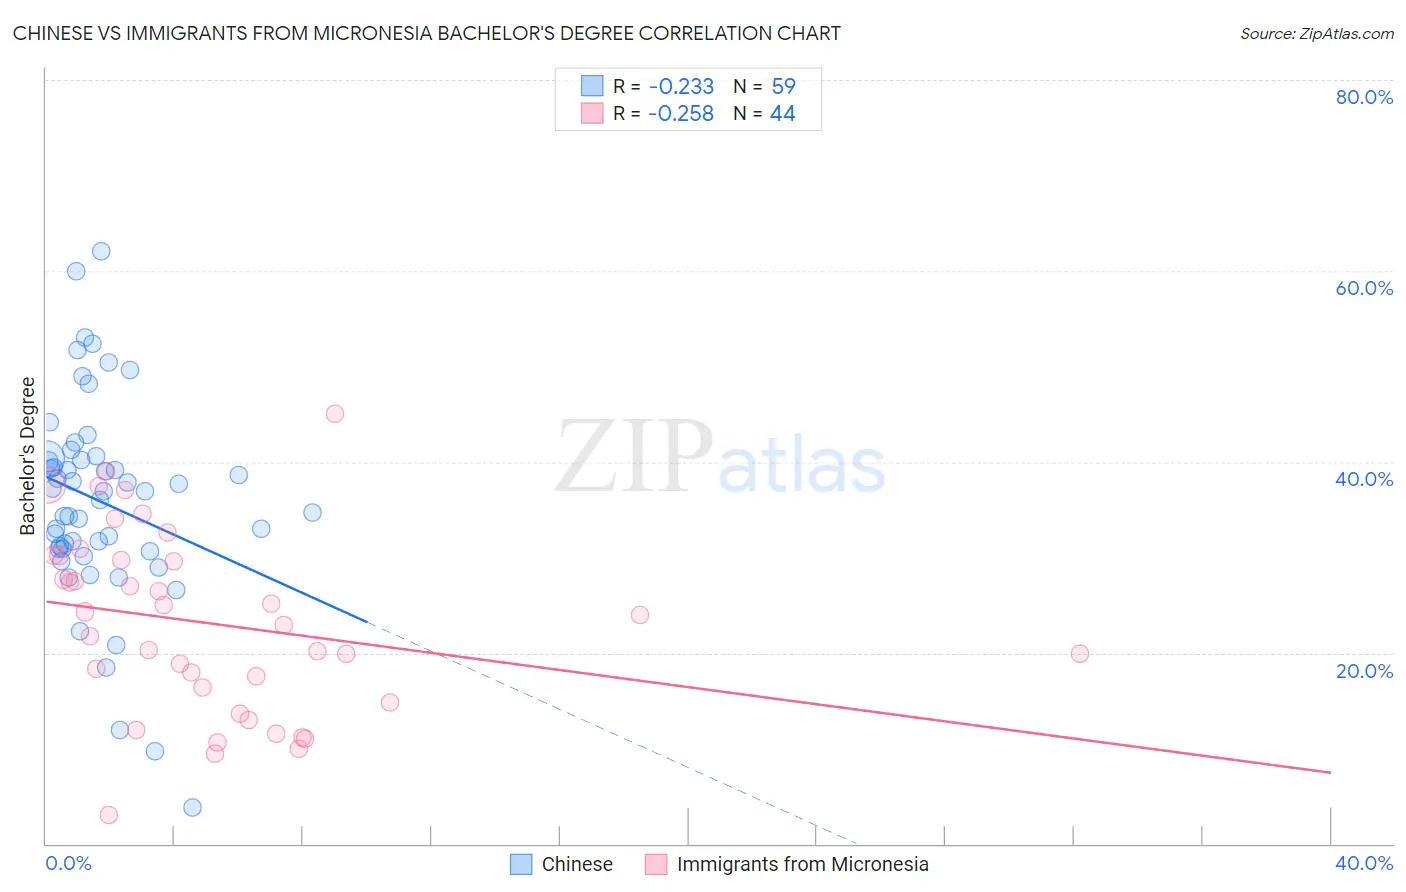
Chinese vs Immigrants from Micronesia Bachelor's Degree Correlation Chart
The statistical analysis conducted on geographies consisting of 64,809,883 people shows a weak negative correlation between the proportion of Chinese and percentage of population with at least bachelor's degree education in the United States with a correlation coefficient (R) of -0.233 and weighted average of 38.5%. Similarly, the statistical analysis conducted on geographies consisting of 61,608,325 people shows a weak negative correlation between the proportion of Immigrants from Micronesia and percentage of population with at least bachelor's degree education in the United States with a correlation coefficient (R) of -0.258 and weighted average of 30.4%, a difference of 26.5%.
Bachelor's Degree Correlation Summary
| Measurement | Chinese | Immigrants from Micronesia |
| Minimum | 3.8% | 3.0% |
| Maximum | 62.0% | 45.0% |
| Range | 58.3% | 42.0% |
| Mean | 35.8% | 23.1% |
| Median | 36.9% | 23.5% |
| Interquartile 25% (IQ1) | 30.9% | 15.6% |
| Interquartile 75% (IQ3) | 40.3% | 29.9% |
| Interquartile Range (IQR) | 9.4% | 14.4% |
| Standard Deviation (Sample) | 10.8% | 9.6% |
| Standard Deviation (Population) | 10.7% | 9.5% |
Similar Demographics by Bachelor's Degree
Demographics Similar to Chinese by Bachelor's Degree
In terms of bachelor's degree, the demographic groups most similar to Chinese are Vietnamese (38.5%, a difference of 0.0%), Uruguayan (38.4%, a difference of 0.090%), Colombian (38.4%, a difference of 0.17%), Immigrants from Germany (38.6%, a difference of 0.33%), and Peruvian (38.3%, a difference of 0.34%).
| Demographics | Rating | Rank | Bachelor's Degree |
| Sudanese | 76.4 /100 | #152 | Good 38.9% |
| Slavs | 75.9 /100 | #153 | Good 38.9% |
| Canadians | 75.0 /100 | #154 | Good 38.8% |
| Immigrants | Kenya | 73.8 /100 | #155 | Good 38.8% |
| Kenyans | 72.5 /100 | #156 | Good 38.7% |
| Immigrants | South America | 70.1 /100 | #157 | Good 38.6% |
| Immigrants | Germany | 69.6 /100 | #158 | Good 38.6% |
| Chinese | 66.6 /100 | #159 | Good 38.5% |
| Vietnamese | 66.6 /100 | #160 | Good 38.5% |
| Uruguayans | 65.8 /100 | #161 | Good 38.4% |
| Colombians | 65.0 /100 | #162 | Good 38.4% |
| Peruvians | 63.4 /100 | #163 | Good 38.3% |
| Hungarians | 62.1 /100 | #164 | Good 38.3% |
| Sri Lankans | 59.1 /100 | #165 | Average 38.2% |
| Somalis | 58.6 /100 | #166 | Average 38.1% |
Demographics Similar to Immigrants from Micronesia by Bachelor's Degree
In terms of bachelor's degree, the demographic groups most similar to Immigrants from Micronesia are Chickasaw (30.4%, a difference of 0.020%), Immigrants from Cuba (30.3%, a difference of 0.22%), Mexican American Indian (30.2%, a difference of 0.49%), Chippewa (30.6%, a difference of 0.54%), and Bangladeshi (30.2%, a difference of 0.66%).
| Demographics | Rating | Rank | Bachelor's Degree |
| Cape Verdeans | 0.1 /100 | #293 | Tragic 30.9% |
| Immigrants | Guatemala | 0.0 /100 | #294 | Tragic 30.8% |
| Immigrants | Dominican Republic | 0.0 /100 | #295 | Tragic 30.7% |
| Puget Sound Salish | 0.0 /100 | #296 | Tragic 30.7% |
| Immigrants | Haiti | 0.0 /100 | #297 | Tragic 30.6% |
| Chippewa | 0.0 /100 | #298 | Tragic 30.6% |
| Chickasaw | 0.0 /100 | #299 | Tragic 30.4% |
| Immigrants | Micronesia | 0.0 /100 | #300 | Tragic 30.4% |
| Immigrants | Cuba | 0.0 /100 | #301 | Tragic 30.3% |
| Mexican American Indians | 0.0 /100 | #302 | Tragic 30.2% |
| Bangladeshis | 0.0 /100 | #303 | Tragic 30.2% |
| Cherokee | 0.0 /100 | #304 | Tragic 30.2% |
| Immigrants | Latin America | 0.0 /100 | #305 | Tragic 30.1% |
| Immigrants | Yemen | 0.0 /100 | #306 | Tragic 29.9% |
| Nepalese | 0.0 /100 | #307 | Tragic 29.9% |