Mexican American Indian vs Indonesian College, 1 year or more

COMPARE

Mexican American Indian
Race
Ancestry
AfghanAfricanAlaska NativeAlaskan AthabascanAlbanianAleutAlsatianAmericanApacheArabArapahoArgentineanArmenianAssyrian/Chaldean/SyriacAustralianAustrianBahamianBangladeshiBarbadianBasqueBelgianBelizeanBermudanBhutaneseBlackfeetBolivianBrazilianBritishBritish West IndianBulgarianBurmeseCajunCambodianCanadianCape VerdeanCarpatho RusynCelticCentral AmericanCentral American IndianCherokeeCheyenneChickasawChileanChineseChippewaChoctawColombianColvilleComancheCosta RicanCreeCreekCroatianCrowCubanCypriotCzechCzechoslovakianDanishDelawareDominicanDutchDutch West IndianEastern EuropeanEcuadorianEgyptianEnglishEstonianEthiopianEuropeanFijianFilipinoFinnishFrenchFrench American IndianFrench CanadianGermanGerman RussianGhanaianGreekGuamanian/ChamorroGuatemalanGuyaneseHaitianHmongHonduranHopiHoumaHungarianIcelanderIndian (Asian)InupiatIranianIraqiIrishIroquoisIsraeliItalianJamaicanJapaneseJordanianKenyanKiowaKoreanLaotianLatvianLebaneseLiberianLithuanianLumbeeLuxembourgerMacedonianMalaysianMalteseMarshalleseMenomineeMexicanMexican American IndianMongolianMoroccanNative HawaiianNavajoNepaleseNew ZealanderNicaraguanNigerianNorthern EuropeanNorwegianOkinawanOsageOttawaPaiutePakistaniPalestinianPanamanianParaguayanPennsylvania GermanPeruvianPimaPolishPortuguesePotawatomiPuebloPuerto RicanPuget Sound SalishRomanianRussianSalvadoranSamoanScandinavianScotch-IrishScottishSeminoleSenegaleseSerbianShoshoneSierra LeoneanSiouxSlavicSlovakSloveneSomaliSouth AfricanSouth AmericanSouth American IndianSoviet UnionSpaniardSpanishSpanish AmericanSpanish American IndianSri LankanSubsaharan AfricanSudaneseSwedishSwissSyrianTaiwaneseThaiTlingit-HaidaTohono O'OdhamTonganTrinidadian and TobagonianTsimshianTurkishU.S. Virgin IslanderUgandanUkrainianUruguayanUteVenezuelanVietnameseWelshWest IndianYakamaYaquiYugoslavianYumanYup'ikZimbabwean
Immigration
NonimmigrantsImmigrantsAfghanistanAfricaAlbaniaArgentinaArmeniaAsiaAustraliaAustriaBahamasBangladeshBarbadosBelarusBelgiumBelizeBoliviaBosnia and HerzegovinaBrazilBulgariaBurma/MyanmarCabo VerdeCambodiaCameroonCanadaCaribbeanCentral AmericaChileChinaColombiaCongoCosta RicaCroatiaCubaCzechoslovakiaDenmarkDominicaDominican RepublicEastern AfricaEastern AsiaEastern EuropeEcuadorEgyptEl SalvadorEnglandEritreaEthiopiaEuropeFijiFranceGermanyGhanaGreeceGrenadaGuatemalaGuyanaHaitiHondurasHong KongHungaryIndiaIndonesiaIranIraqIrelandIsraelItalyJamaicaJapanJordanKazakhstanKenyaKoreaKuwaitLaosLatin AmericaLatviaLebanonLiberiaLithuaniaMalaysiaMexicoMicronesiaMiddle AfricaMoldovaMoroccoNepalNetherlandsNicaraguaNigeriaNorth AmericaNorth MacedoniaNorthern AfricaNorthern EuropeNorwayOceaniaPakistanPanamaPeruPhilippinesPolandPortugalRomaniaRussiaSaudi ArabiaScotlandSenegalSerbiaSierra LeoneSingaporeSomaliaSouth AfricaSouth AmericaSouth Central AsiaSouth Eastern AsiaSouthern EuropeSpainSri LankaSt. Vincent and the GrenadinesSudanSwedenSwitzerlandSyriaTaiwanThailandTrinidad and TobagoTurkeyUgandaUkraineUruguayUzbekistanVenezuelaVietnamWest IndiesWestern AfricaWestern AsiaWestern EuropeYemenZaireZimbabweAzores
Indonesian
Race
Ancestry
AfghanAfricanAlaska NativeAlaskan AthabascanAlbanianAleutAlsatianAmericanApacheArabArapahoArgentineanArmenianAssyrian/Chaldean/SyriacAustralianAustrianBahamianBangladeshiBarbadianBasqueBelgianBelizeanBermudanBhutaneseBlackfeetBolivianBrazilianBritishBritish West IndianBulgarianBurmeseCajunCambodianCanadianCape VerdeanCarpatho RusynCelticCentral AmericanCentral American IndianCherokeeCheyenneChickasawChileanChineseChippewaChoctawColombianColvilleComancheCosta RicanCreeCreekCroatianCrowCubanCypriotCzechCzechoslovakianDanishDelawareDominicanDutchDutch West IndianEastern EuropeanEcuadorianEgyptianEnglishEstonianEthiopianEuropeanFijianFilipinoFinnishFrenchFrench American IndianFrench CanadianGermanGerman RussianGhanaianGreekGuamanian/ChamorroGuatemalanGuyaneseHaitianHmongHonduranHopiHoumaHungarianIcelanderIndian (Asian)IndonesianInupiatIranianIraqiIrishIroquoisIsraeliItalianJamaicanJapaneseJordanianKenyanKiowaKoreanLaotianLatvianLebaneseLiberianLithuanianLumbeeLuxembourgerMacedonianMalaysianMalteseMarshalleseMenomineeMexicanMongolianMoroccanNative HawaiianNavajoNepaleseNew ZealanderNicaraguanNigerianNorthern EuropeanNorwegianOkinawanOsageOttawaPaiutePakistaniPalestinianPanamanianParaguayanPennsylvania GermanPeruvianPimaPolishPortuguesePotawatomiPuebloPuerto RicanPuget Sound SalishRomanianRussianSalvadoranSamoanScandinavianScotch-IrishScottishSeminoleSenegaleseSerbianShoshoneSierra LeoneanSiouxSlavicSlovakSloveneSomaliSouth AfricanSouth AmericanSouth American IndianSoviet UnionSpaniardSpanishSpanish AmericanSpanish American IndianSri LankanSubsaharan AfricanSudaneseSwedishSwissSyrianTaiwaneseThaiTlingit-HaidaTohono O'OdhamTonganTrinidadian and TobagonianTsimshianTurkishU.S. Virgin IslanderUgandanUkrainianUruguayanUteVenezuelanVietnameseWelshWest IndianYakamaYaquiYugoslavianYumanYup'ikZimbabwean
Immigration
NonimmigrantsImmigrantsAfghanistanAfricaAlbaniaArgentinaArmeniaAsiaAustraliaAustriaBahamasBangladeshBarbadosBelarusBelgiumBelizeBoliviaBosnia and HerzegovinaBrazilBulgariaBurma/MyanmarCabo VerdeCambodiaCameroonCanadaCaribbeanCentral AmericaChileChinaColombiaCongoCosta RicaCroatiaCubaCzechoslovakiaDenmarkDominicaDominican RepublicEastern AfricaEastern AsiaEastern EuropeEcuadorEgyptEl SalvadorEnglandEritreaEthiopiaEuropeFijiFranceGermanyGhanaGreeceGrenadaGuatemalaGuyanaHaitiHondurasHong KongHungaryIndiaIndonesiaIranIraqIrelandIsraelItalyJamaicaJapanJordanKazakhstanKenyaKoreaKuwaitLaosLatin AmericaLatviaLebanonLiberiaLithuaniaMalaysiaMexicoMicronesiaMiddle AfricaMoldovaMoroccoNepalNetherlandsNicaraguaNigeriaNorth AmericaNorth MacedoniaNorthern AfricaNorthern EuropeNorwayOceaniaPakistanPanamaPeruPhilippinesPolandPortugalRomaniaRussiaSaudi ArabiaScotlandSenegalSerbiaSierra LeoneSingaporeSomaliaSouth AfricaSouth AmericaSouth Central AsiaSouth Eastern AsiaSouthern EuropeSpainSri LankaSt. Vincent and the GrenadinesSudanSwedenSwitzerlandSyriaTaiwanThailandTrinidad and TobagoTurkeyUgandaUkraineUruguayUzbekistanVenezuelaVietnamWest IndiesWestern AfricaWestern AsiaWestern EuropeYemenZaireZimbabweAzores
College, 1 year or more
Income
Poverty
Unemployment
Labor Participation
Family Structure
Vehicle Availability
Education Level
Disability

College, 1 year or more Comparison

Mexican American Indians

Indonesians

Tragic
Tragic
51.9%
COLLEGE, 1 YEAR OR MORE
0.0/ 100
METRIC RATING
306th/ 347
METRIC RANK
55.1%
COLLEGE, 1 YEAR OR MORE
0.4/ 100
METRIC RATING
257th/ 347
METRIC RANK

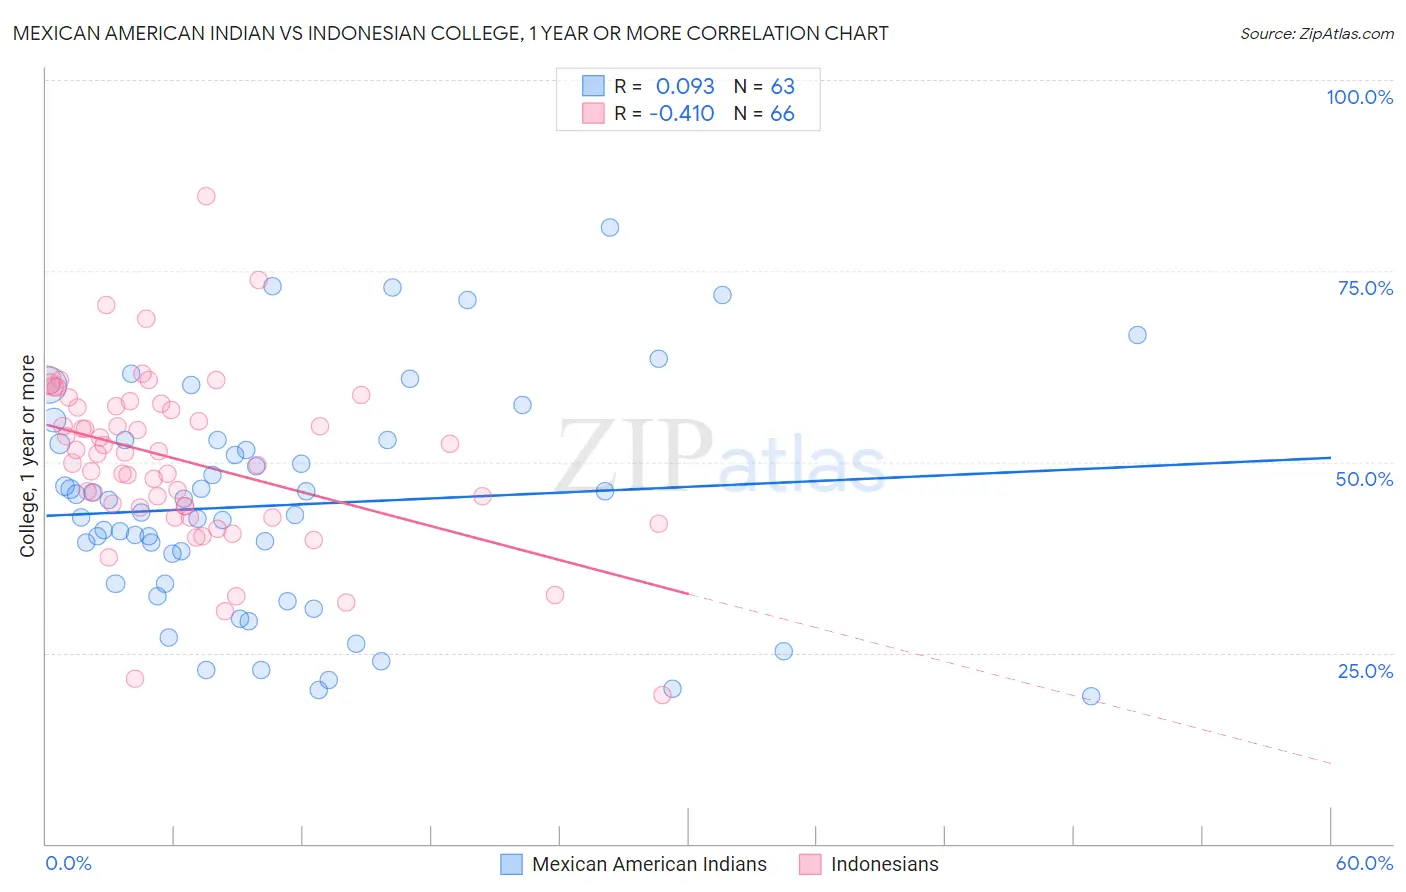
Mexican American Indian vs Indonesian College, 1 year or more Correlation Chart

The statistical analysis conducted on geographies consisting of 317,621,155 people shows a slight positive correlation between the proportion of Mexican American Indians and percentage of population with at least college, 1 year or more education in the United States with a correlation coefficient (R) of 0.093 and weighted average of 51.9%. Similarly, the statistical analysis conducted on geographies consisting of 162,727,113 people shows a moderate negative correlation between the proportion of Indonesians and percentage of population with at least college, 1 year or more education in the United States with a correlation coefficient (R) of -0.410 and weighted average of 55.1%, a difference of 6.2%.
Mexican American Indian vs Indonesian College, 1 year or more

College, 1 year or more Correlation Summary

MeasurementMexican American IndianIndonesian
Minimum19.3%19.4%
Maximum80.8%84.8%
Range61.4%65.3%
Mean44.3%50.1%
Median43.4%51.1%
Interquartile 25% (IQ1)34.0%44.0%
Interquartile 75% (IQ3)52.8%57.3%
Interquartile Range (IQR)18.8%13.3%
Standard Deviation (Sample)14.6%11.2%
Standard Deviation (Population)14.5%11.1%

Similar Demographics by College, 1 year or more

Demographics Similar to Mexican American Indians by College, 1 year or more

In terms of college, 1 year or more, the demographic groups most similar to Mexican American Indians are Immigrants from Portugal (51.9%, a difference of 0.10%), Salvadoran (51.8%, a difference of 0.20%), Apache (51.8%, a difference of 0.22%), Seminole (52.1%, a difference of 0.33%), and Central American (52.1%, a difference of 0.43%).
DemographicsRating | RankCollege, 1 year or more
Immigrants | Nicaragua
0.0
/100
|
#299
Tragic
52.4%
Choctaw
0.0
/100
|
#300
Tragic
52.3%
Haitians
0.0
/100
|
#301
Tragic
52.3%
Puerto Ricans
0.0
/100
|
#302
Tragic
52.2%
Creek
0.0
/100
|
#303
Tragic
52.2%
Central Americans
0.0
/100
|
#304
Tragic
52.1%
Seminole
0.0
/100
|
#305
Tragic
52.1%
Mexican American Indians
0.0
/100
|
#306
Tragic
51.9%
Immigrants | Portugal
0.0
/100
|
#307
Tragic
51.9%
Salvadorans
0.0
/100
|
#308
Tragic
51.8%
Apache
0.0
/100
|
#309
Tragic
51.8%
Hondurans
0.0
/100
|
#310
Tragic
51.6%
Immigrants | Haiti
0.0
/100
|
#311
Tragic
51.5%
Pueblo
0.0
/100
|
#312
Tragic
51.5%
Immigrants | Caribbean
0.0
/100
|
#313
Tragic
51.4%

Demographics Similar to Indonesians by College, 1 year or more

In terms of college, 1 year or more, the demographic groups most similar to Indonesians are Immigrants from West Indies (55.2%, a difference of 0.10%), Immigrants from Bahamas (55.2%, a difference of 0.17%), Japanese (55.2%, a difference of 0.22%), African (55.0%, a difference of 0.28%), and Nepalese (54.9%, a difference of 0.34%).
DemographicsRating | RankCollege, 1 year or more
Delaware
0.7
/100
|
#250
Tragic
55.5%
Immigrants | Cambodia
0.6
/100
|
#251
Tragic
55.4%
Aleuts
0.6
/100
|
#252
Tragic
55.4%
Immigrants | Barbados
0.6
/100
|
#253
Tragic
55.4%
Japanese
0.5
/100
|
#254
Tragic
55.2%
Immigrants | Bahamas
0.5
/100
|
#255
Tragic
55.2%
Immigrants | West Indies
0.5
/100
|
#256
Tragic
55.2%
Indonesians
0.4
/100
|
#257
Tragic
55.1%
Africans
0.4
/100
|
#258
Tragic
55.0%
Nepalese
0.3
/100
|
#259
Tragic
54.9%
Jamaicans
0.3
/100
|
#260
Tragic
54.9%
Ottawa
0.3
/100
|
#261
Tragic
54.9%
Immigrants | St. Vincent and the Grenadines
0.3
/100
|
#262
Tragic
54.8%
U.S. Virgin Islanders
0.3
/100
|
#263
Tragic
54.8%
Immigrants | Micronesia
0.3
/100
|
#264
Tragic
54.8%