Marshallese vs Immigrants from Egypt College, Under 1 year
COMPARE
Marshallese
Immigrants from Egypt
College, Under 1 year
College, Under 1 year Comparison
Marshallese
Immigrants from Egypt
61.9%
COLLEGE, UNDER 1 YEAR
0.8/ 100
METRIC RATING
246th/ 347
METRIC RANK
67.7%
COLLEGE, UNDER 1 YEAR
96.0/ 100
METRIC RATING
108th/ 347
METRIC RANK
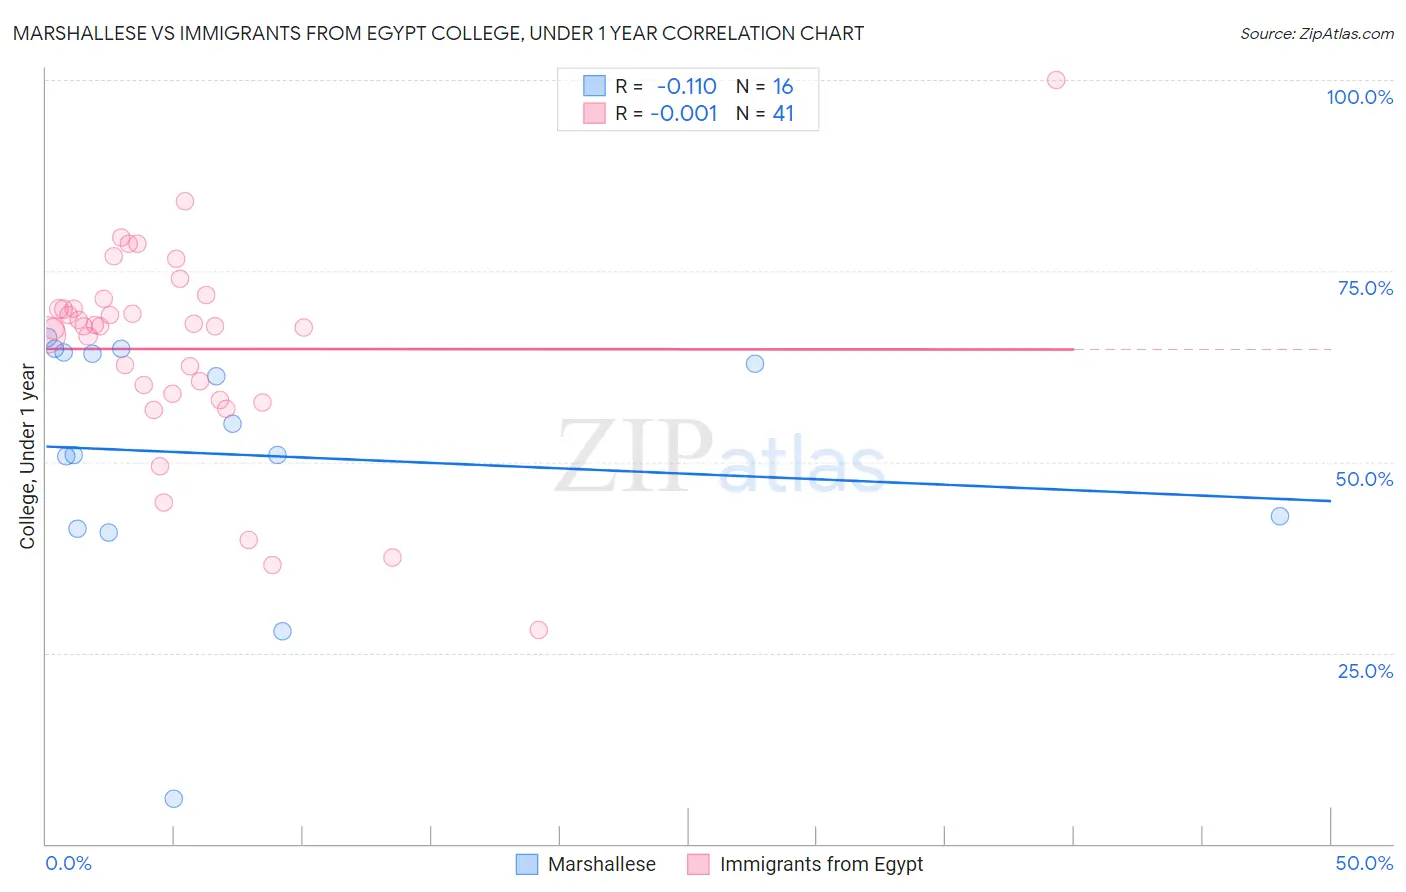
Marshallese vs Immigrants from Egypt College, Under 1 year Correlation Chart
The statistical analysis conducted on geographies consisting of 14,761,315 people shows a poor negative correlation between the proportion of Marshallese and percentage of population with at least college, under 1 year education in the United States with a correlation coefficient (R) of -0.110 and weighted average of 61.9%. Similarly, the statistical analysis conducted on geographies consisting of 245,485,794 people shows no correlation between the proportion of Immigrants from Egypt and percentage of population with at least college, under 1 year education in the United States with a correlation coefficient (R) of -0.001 and weighted average of 67.7%, a difference of 9.3%.
College, Under 1 year Correlation Summary
| Measurement | Marshallese | Immigrants from Egypt |
| Minimum | 5.9% | 28.0% |
| Maximum | 66.3% | 100.0% |
| Range | 60.4% | 72.0% |
| Mean | 50.9% | 64.8% |
| Median | 52.9% | 67.8% |
| Interquartile 25% (IQ1) | 42.1% | 58.6% |
| Interquartile 75% (IQ3) | 64.2% | 70.7% |
| Interquartile Range (IQR) | 22.1% | 12.1% |
| Standard Deviation (Sample) | 16.5% | 13.6% |
| Standard Deviation (Population) | 15.9% | 13.4% |
Similar Demographics by College, Under 1 year
Demographics Similar to Marshallese by College, Under 1 year
In terms of college, under 1 year, the demographic groups most similar to Marshallese are Immigrants from Liberia (61.9%, a difference of 0.020%), Delaware (62.1%, a difference of 0.22%), Potawatomi (61.8%, a difference of 0.26%), Colville (62.1%, a difference of 0.28%), and Hawaiian (62.1%, a difference of 0.37%).
| Demographics | Rating | Rank | College, Under 1 year |
| Nepalese | 1.1 /100 | #239 | Tragic 62.2% |
| Aleuts | 1.1 /100 | #240 | Tragic 62.2% |
| Ottawa | 1.1 /100 | #241 | Tragic 62.2% |
| Malaysians | 1.1 /100 | #242 | Tragic 62.2% |
| Hawaiians | 1.1 /100 | #243 | Tragic 62.1% |
| Colville | 1.0 /100 | #244 | Tragic 62.1% |
| Delaware | 0.9 /100 | #245 | Tragic 62.1% |
| Marshallese | 0.8 /100 | #246 | Tragic 61.9% |
| Immigrants | Liberia | 0.8 /100 | #247 | Tragic 61.9% |
| Potawatomi | 0.6 /100 | #248 | Tragic 61.8% |
| Vietnamese | 0.5 /100 | #249 | Tragic 61.7% |
| Immigrants | Congo | 0.5 /100 | #250 | Tragic 61.7% |
| Immigrants | Micronesia | 0.5 /100 | #251 | Tragic 61.5% |
| West Indians | 0.4 /100 | #252 | Tragic 61.5% |
| Japanese | 0.4 /100 | #253 | Tragic 61.5% |
Demographics Similar to Immigrants from Egypt by College, Under 1 year
In terms of college, under 1 year, the demographic groups most similar to Immigrants from Egypt are Scandinavian (67.7%, a difference of 0.060%), Assyrian/Chaldean/Syriac (67.7%, a difference of 0.060%), Ukrainian (67.7%, a difference of 0.060%), Macedonian (67.6%, a difference of 0.080%), and Syrian (67.6%, a difference of 0.11%).
| Demographics | Rating | Rank | College, Under 1 year |
| Immigrants | Eastern Europe | 96.9 /100 | #101 | Exceptional 67.9% |
| Palestinians | 96.9 /100 | #102 | Exceptional 67.9% |
| Carpatho Rusyns | 96.8 /100 | #103 | Exceptional 67.9% |
| Immigrants | Western Asia | 96.6 /100 | #104 | Exceptional 67.8% |
| Afghans | 96.6 /100 | #105 | Exceptional 67.8% |
| Immigrants | Croatia | 96.6 /100 | #106 | Exceptional 67.8% |
| Austrians | 96.4 /100 | #107 | Exceptional 67.8% |
| Immigrants | Egypt | 96.0 /100 | #108 | Exceptional 67.7% |
| Scandinavians | 95.8 /100 | #109 | Exceptional 67.7% |
| Assyrians/Chaldeans/Syriacs | 95.8 /100 | #110 | Exceptional 67.7% |
| Ukrainians | 95.8 /100 | #111 | Exceptional 67.7% |
| Macedonians | 95.7 /100 | #112 | Exceptional 67.6% |
| Syrians | 95.6 /100 | #113 | Exceptional 67.6% |
| Chileans | 95.3 /100 | #114 | Exceptional 67.6% |
| Basques | 95.2 /100 | #115 | Exceptional 67.6% |