Marshallese vs Comanche College, Under 1 year
COMPARE
Marshallese
Comanche
College, Under 1 year
College, Under 1 year Comparison
Marshallese
Comanche
61.9%
COLLEGE, UNDER 1 YEAR
0.8/ 100
METRIC RATING
246th/ 347
METRIC RANK
61.4%
COLLEGE, UNDER 1 YEAR
0.4/ 100
METRIC RATING
255th/ 347
METRIC RANK
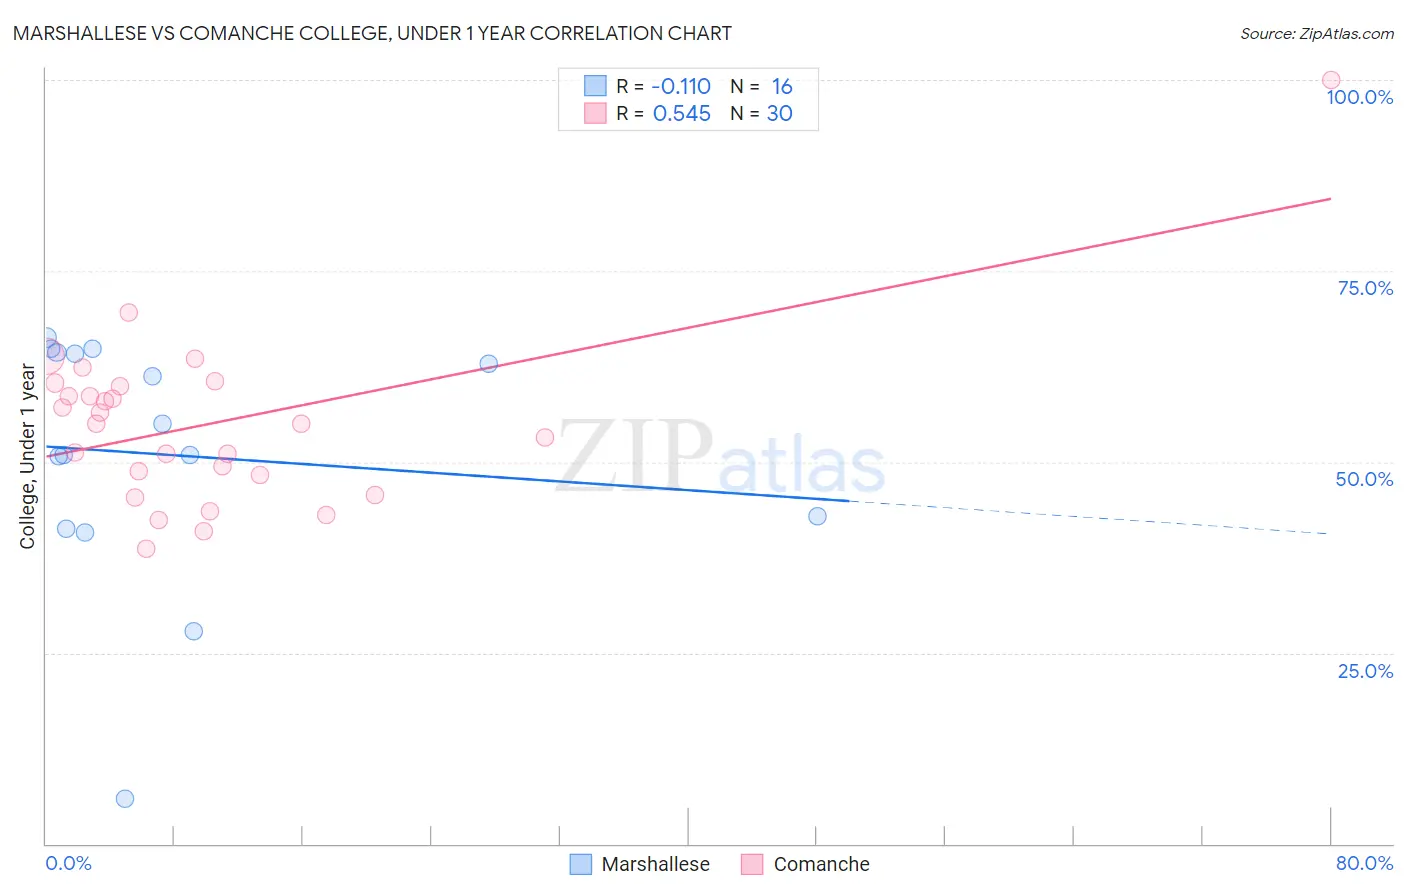
Marshallese vs Comanche College, Under 1 year Correlation Chart
The statistical analysis conducted on geographies consisting of 14,761,315 people shows a poor negative correlation between the proportion of Marshallese and percentage of population with at least college, under 1 year education in the United States with a correlation coefficient (R) of -0.110 and weighted average of 61.9%. Similarly, the statistical analysis conducted on geographies consisting of 109,786,512 people shows a substantial positive correlation between the proportion of Comanche and percentage of population with at least college, under 1 year education in the United States with a correlation coefficient (R) of 0.545 and weighted average of 61.4%, a difference of 0.85%.
College, Under 1 year Correlation Summary
| Measurement | Marshallese | Comanche |
| Minimum | 5.9% | 38.6% |
| Maximum | 66.3% | 100.0% |
| Range | 60.4% | 61.4% |
| Mean | 50.9% | 55.0% |
| Median | 52.9% | 54.9% |
| Interquartile 25% (IQ1) | 42.1% | 48.4% |
| Interquartile 75% (IQ3) | 64.2% | 60.0% |
| Interquartile Range (IQR) | 22.1% | 11.6% |
| Standard Deviation (Sample) | 16.5% | 11.5% |
| Standard Deviation (Population) | 15.9% | 11.3% |
Demographics Similar to Marshallese and Comanche by College, Under 1 year
In terms of college, under 1 year, the demographic groups most similar to Marshallese are Immigrants from Liberia (61.9%, a difference of 0.020%), Delaware (62.1%, a difference of 0.22%), Potawatomi (61.8%, a difference of 0.26%), Colville (62.1%, a difference of 0.28%), and Hawaiian (62.1%, a difference of 0.37%). Similarly, the demographic groups most similar to Comanche are Bangladeshi (61.4%, a difference of 0.040%), Immigrants from Cambodia (61.5%, a difference of 0.12%), West Indian (61.5%, a difference of 0.13%), Japanese (61.5%, a difference of 0.13%), and Immigrants from Laos (61.3%, a difference of 0.16%).
| Demographics | Rating | Rank | College, Under 1 year |
| Aleuts | 1.1 /100 | #240 | Tragic 62.2% |
| Ottawa | 1.1 /100 | #241 | Tragic 62.2% |
| Malaysians | 1.1 /100 | #242 | Tragic 62.2% |
| Hawaiians | 1.1 /100 | #243 | Tragic 62.1% |
| Colville | 1.0 /100 | #244 | Tragic 62.1% |
| Delaware | 0.9 /100 | #245 | Tragic 62.1% |
| Marshallese | 0.8 /100 | #246 | Tragic 61.9% |
| Immigrants | Liberia | 0.8 /100 | #247 | Tragic 61.9% |
| Potawatomi | 0.6 /100 | #248 | Tragic 61.8% |
| Vietnamese | 0.5 /100 | #249 | Tragic 61.7% |
| Immigrants | Congo | 0.5 /100 | #250 | Tragic 61.7% |
| Immigrants | Micronesia | 0.5 /100 | #251 | Tragic 61.5% |
| West Indians | 0.4 /100 | #252 | Tragic 61.5% |
| Japanese | 0.4 /100 | #253 | Tragic 61.5% |
| Immigrants | Cambodia | 0.4 /100 | #254 | Tragic 61.5% |
| Comanche | 0.4 /100 | #255 | Tragic 61.4% |
| Bangladeshis | 0.4 /100 | #256 | Tragic 61.4% |
| Immigrants | Laos | 0.3 /100 | #257 | Tragic 61.3% |
| Immigrants | Bangladesh | 0.3 /100 | #258 | Tragic 61.3% |
| Indonesians | 0.3 /100 | #259 | Tragic 61.2% |
| Blackfeet | 0.3 /100 | #260 | Tragic 61.1% |