Pakistani vs Immigrants from Egypt College, Under 1 year
COMPARE
Pakistani
Immigrants from Egypt
College, Under 1 year
College, Under 1 year Comparison
Pakistanis
Immigrants from Egypt
67.5%
COLLEGE, UNDER 1 YEAR
94.8/ 100
METRIC RATING
117th/ 347
METRIC RANK
67.7%
COLLEGE, UNDER 1 YEAR
96.0/ 100
METRIC RATING
108th/ 347
METRIC RANK
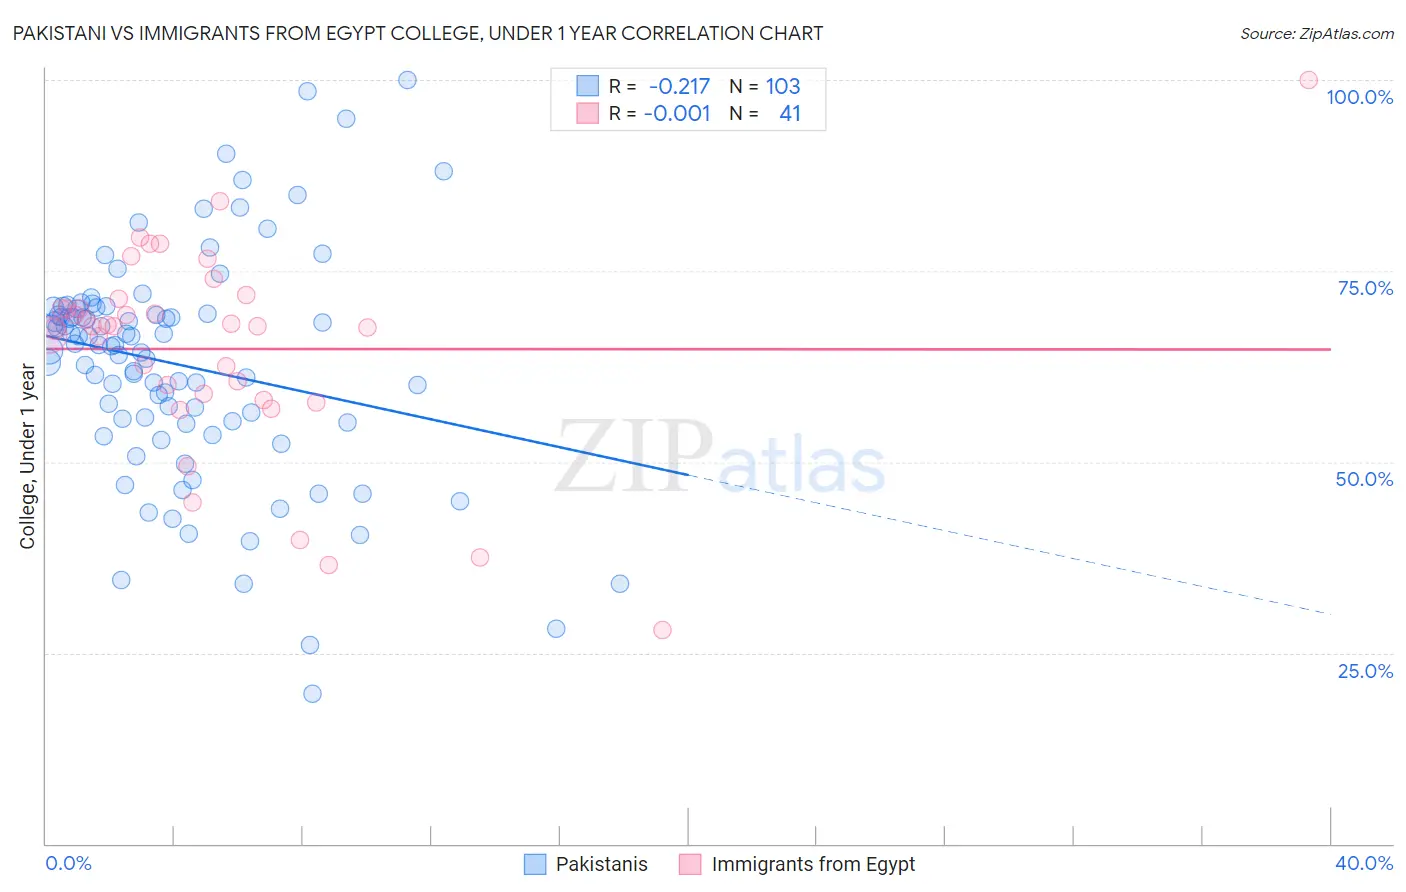
Pakistani vs Immigrants from Egypt College, Under 1 year Correlation Chart
The statistical analysis conducted on geographies consisting of 335,356,650 people shows a weak negative correlation between the proportion of Pakistanis and percentage of population with at least college, under 1 year education in the United States with a correlation coefficient (R) of -0.217 and weighted average of 67.5%. Similarly, the statistical analysis conducted on geographies consisting of 245,485,794 people shows no correlation between the proportion of Immigrants from Egypt and percentage of population with at least college, under 1 year education in the United States with a correlation coefficient (R) of -0.001 and weighted average of 67.7%, a difference of 0.29%.
College, Under 1 year Correlation Summary
| Measurement | Pakistani | Immigrants from Egypt |
| Minimum | 19.6% | 28.0% |
| Maximum | 100.0% | 100.0% |
| Range | 80.4% | 72.0% |
| Mean | 62.7% | 64.8% |
| Median | 65.2% | 67.8% |
| Interquartile 25% (IQ1) | 55.2% | 58.6% |
| Interquartile 75% (IQ3) | 70.0% | 70.7% |
| Interquartile Range (IQR) | 14.8% | 12.1% |
| Standard Deviation (Sample) | 14.8% | 13.6% |
| Standard Deviation (Population) | 14.7% | 13.4% |
Demographics Similar to Pakistanis and Immigrants from Egypt by College, Under 1 year
In terms of college, under 1 year, the demographic groups most similar to Pakistanis are Immigrants from Nepal (67.5%, a difference of 0.020%), Immigrants from Ukraine (67.5%, a difference of 0.030%), Lebanese (67.5%, a difference of 0.040%), Basque (67.6%, a difference of 0.10%), and Chilean (67.6%, a difference of 0.11%). Similarly, the demographic groups most similar to Immigrants from Egypt are Scandinavian (67.7%, a difference of 0.060%), Assyrian/Chaldean/Syriac (67.7%, a difference of 0.060%), Ukrainian (67.7%, a difference of 0.060%), Macedonian (67.6%, a difference of 0.080%), and Syrian (67.6%, a difference of 0.11%).
| Demographics | Rating | Rank | College, Under 1 year |
| Palestinians | 96.9 /100 | #102 | Exceptional 67.9% |
| Carpatho Rusyns | 96.8 /100 | #103 | Exceptional 67.9% |
| Immigrants | Western Asia | 96.6 /100 | #104 | Exceptional 67.8% |
| Afghans | 96.6 /100 | #105 | Exceptional 67.8% |
| Immigrants | Croatia | 96.6 /100 | #106 | Exceptional 67.8% |
| Austrians | 96.4 /100 | #107 | Exceptional 67.8% |
| Immigrants | Egypt | 96.0 /100 | #108 | Exceptional 67.7% |
| Scandinavians | 95.8 /100 | #109 | Exceptional 67.7% |
| Assyrians/Chaldeans/Syriacs | 95.8 /100 | #110 | Exceptional 67.7% |
| Ukrainians | 95.8 /100 | #111 | Exceptional 67.7% |
| Macedonians | 95.7 /100 | #112 | Exceptional 67.6% |
| Syrians | 95.6 /100 | #113 | Exceptional 67.6% |
| Chileans | 95.3 /100 | #114 | Exceptional 67.6% |
| Basques | 95.2 /100 | #115 | Exceptional 67.6% |
| Immigrants | Nepal | 94.9 /100 | #116 | Exceptional 67.5% |
| Pakistanis | 94.8 /100 | #117 | Exceptional 67.5% |
| Immigrants | Ukraine | 94.7 /100 | #118 | Exceptional 67.5% |
| Lebanese | 94.6 /100 | #119 | Exceptional 67.5% |
| Serbians | 93.9 /100 | #120 | Exceptional 67.4% |
| Slovenes | 93.3 /100 | #121 | Exceptional 67.3% |
| Immigrants | Jordan | 92.8 /100 | #122 | Exceptional 67.3% |