Barbadian vs Immigrants from Egypt College, Under 1 year
COMPARE
Barbadian
Immigrants from Egypt
College, Under 1 year
College, Under 1 year Comparison
Barbadians
Immigrants from Egypt
61.1%
COLLEGE, UNDER 1 YEAR
0.2/ 100
METRIC RATING
262nd/ 347
METRIC RANK
67.7%
COLLEGE, UNDER 1 YEAR
96.0/ 100
METRIC RATING
108th/ 347
METRIC RANK
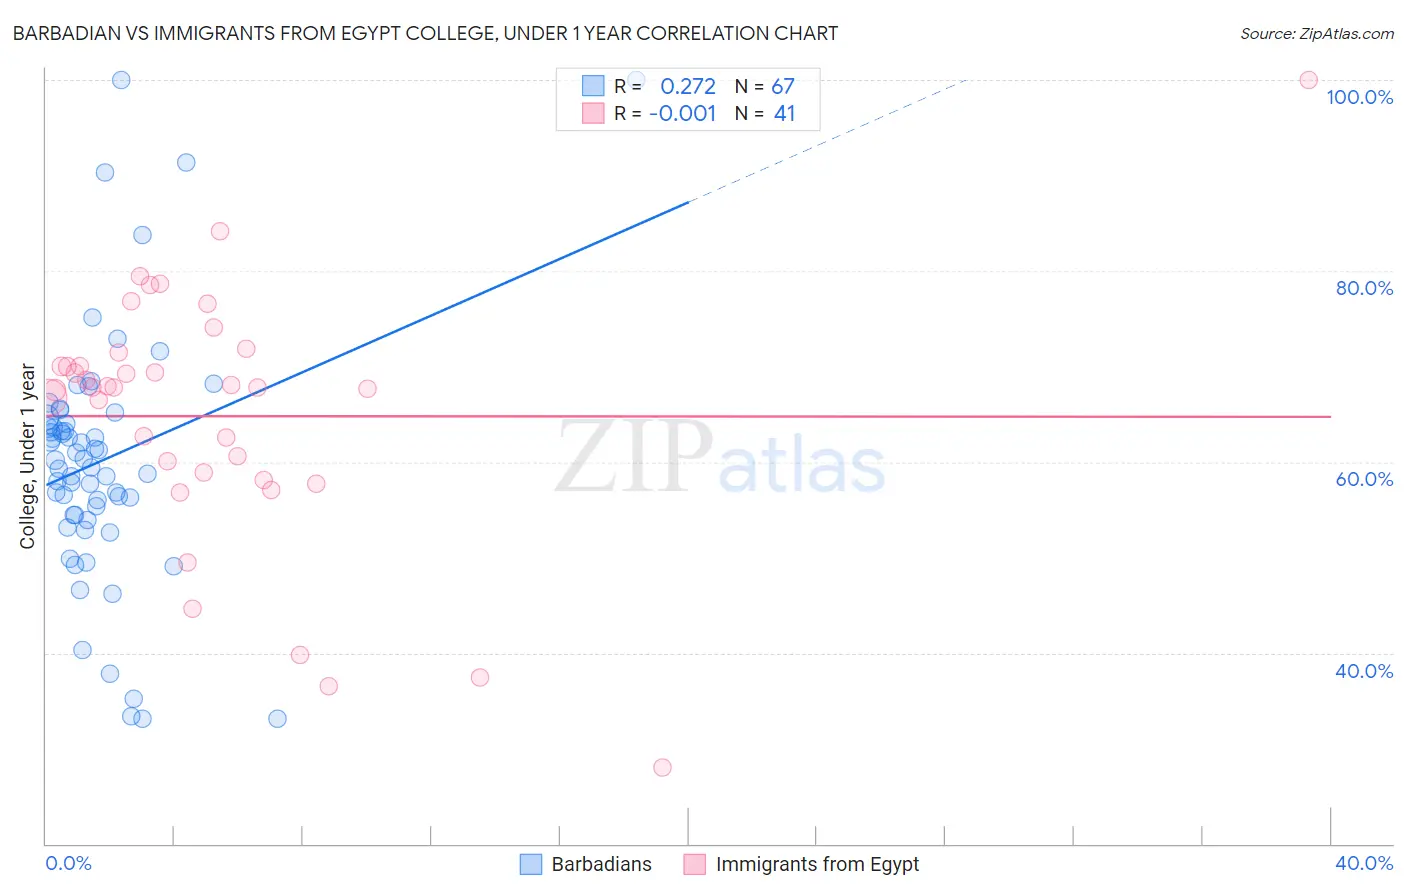
Barbadian vs Immigrants from Egypt College, Under 1 year Correlation Chart
The statistical analysis conducted on geographies consisting of 141,304,590 people shows a weak positive correlation between the proportion of Barbadians and percentage of population with at least college, under 1 year education in the United States with a correlation coefficient (R) of 0.272 and weighted average of 61.1%. Similarly, the statistical analysis conducted on geographies consisting of 245,485,794 people shows no correlation between the proportion of Immigrants from Egypt and percentage of population with at least college, under 1 year education in the United States with a correlation coefficient (R) of -0.001 and weighted average of 67.7%, a difference of 10.8%.
College, Under 1 year Correlation Summary
| Measurement | Barbadian | Immigrants from Egypt |
| Minimum | 33.0% | 28.0% |
| Maximum | 100.0% | 100.0% |
| Range | 67.0% | 72.0% |
| Mean | 60.2% | 64.8% |
| Median | 60.2% | 67.8% |
| Interquartile 25% (IQ1) | 54.4% | 58.6% |
| Interquartile 75% (IQ3) | 64.7% | 70.7% |
| Interquartile Range (IQR) | 10.3% | 12.1% |
| Standard Deviation (Sample) | 13.2% | 13.6% |
| Standard Deviation (Population) | 13.1% | 13.4% |
Similar Demographics by College, Under 1 year
Demographics Similar to Barbadians by College, Under 1 year
In terms of college, under 1 year, the demographic groups most similar to Barbadians are Shoshone (61.1%, a difference of 0.010%), African (61.1%, a difference of 0.040%), Blackfeet (61.1%, a difference of 0.070%), Trinidadian and Tobagonian (61.1%, a difference of 0.070%), and Immigrants from Bahamas (61.1%, a difference of 0.070%).
| Demographics | Rating | Rank | College, Under 1 year |
| Comanche | 0.4 /100 | #255 | Tragic 61.4% |
| Bangladeshis | 0.4 /100 | #256 | Tragic 61.4% |
| Immigrants | Laos | 0.3 /100 | #257 | Tragic 61.3% |
| Immigrants | Bangladesh | 0.3 /100 | #258 | Tragic 61.3% |
| Indonesians | 0.3 /100 | #259 | Tragic 61.2% |
| Blackfeet | 0.3 /100 | #260 | Tragic 61.1% |
| Africans | 0.3 /100 | #261 | Tragic 61.1% |
| Barbadians | 0.2 /100 | #262 | Tragic 61.1% |
| Shoshone | 0.2 /100 | #263 | Tragic 61.1% |
| Trinidadians and Tobagonians | 0.2 /100 | #264 | Tragic 61.1% |
| Immigrants | Bahamas | 0.2 /100 | #265 | Tragic 61.1% |
| Alaskan Athabascans | 0.2 /100 | #266 | Tragic 61.0% |
| Americans | 0.2 /100 | #267 | Tragic 61.0% |
| Immigrants | Trinidad and Tobago | 0.1 /100 | #268 | Tragic 60.7% |
| Immigrants | West Indies | 0.1 /100 | #269 | Tragic 60.6% |
Demographics Similar to Immigrants from Egypt by College, Under 1 year
In terms of college, under 1 year, the demographic groups most similar to Immigrants from Egypt are Scandinavian (67.7%, a difference of 0.060%), Assyrian/Chaldean/Syriac (67.7%, a difference of 0.060%), Ukrainian (67.7%, a difference of 0.060%), Macedonian (67.6%, a difference of 0.080%), and Syrian (67.6%, a difference of 0.11%).
| Demographics | Rating | Rank | College, Under 1 year |
| Immigrants | Eastern Europe | 96.9 /100 | #101 | Exceptional 67.9% |
| Palestinians | 96.9 /100 | #102 | Exceptional 67.9% |
| Carpatho Rusyns | 96.8 /100 | #103 | Exceptional 67.9% |
| Immigrants | Western Asia | 96.6 /100 | #104 | Exceptional 67.8% |
| Afghans | 96.6 /100 | #105 | Exceptional 67.8% |
| Immigrants | Croatia | 96.6 /100 | #106 | Exceptional 67.8% |
| Austrians | 96.4 /100 | #107 | Exceptional 67.8% |
| Immigrants | Egypt | 96.0 /100 | #108 | Exceptional 67.7% |
| Scandinavians | 95.8 /100 | #109 | Exceptional 67.7% |
| Assyrians/Chaldeans/Syriacs | 95.8 /100 | #110 | Exceptional 67.7% |
| Ukrainians | 95.8 /100 | #111 | Exceptional 67.7% |
| Macedonians | 95.7 /100 | #112 | Exceptional 67.6% |
| Syrians | 95.6 /100 | #113 | Exceptional 67.6% |
| Chileans | 95.3 /100 | #114 | Exceptional 67.6% |
| Basques | 95.2 /100 | #115 | Exceptional 67.6% |