Marshallese vs Paiute College, Under 1 year
COMPARE
Marshallese
Paiute
College, Under 1 year
College, Under 1 year Comparison
Marshallese
Paiute
61.9%
COLLEGE, UNDER 1 YEAR
0.8/ 100
METRIC RATING
246th/ 347
METRIC RANK
59.6%
COLLEGE, UNDER 1 YEAR
0.0/ 100
METRIC RATING
285th/ 347
METRIC RANK
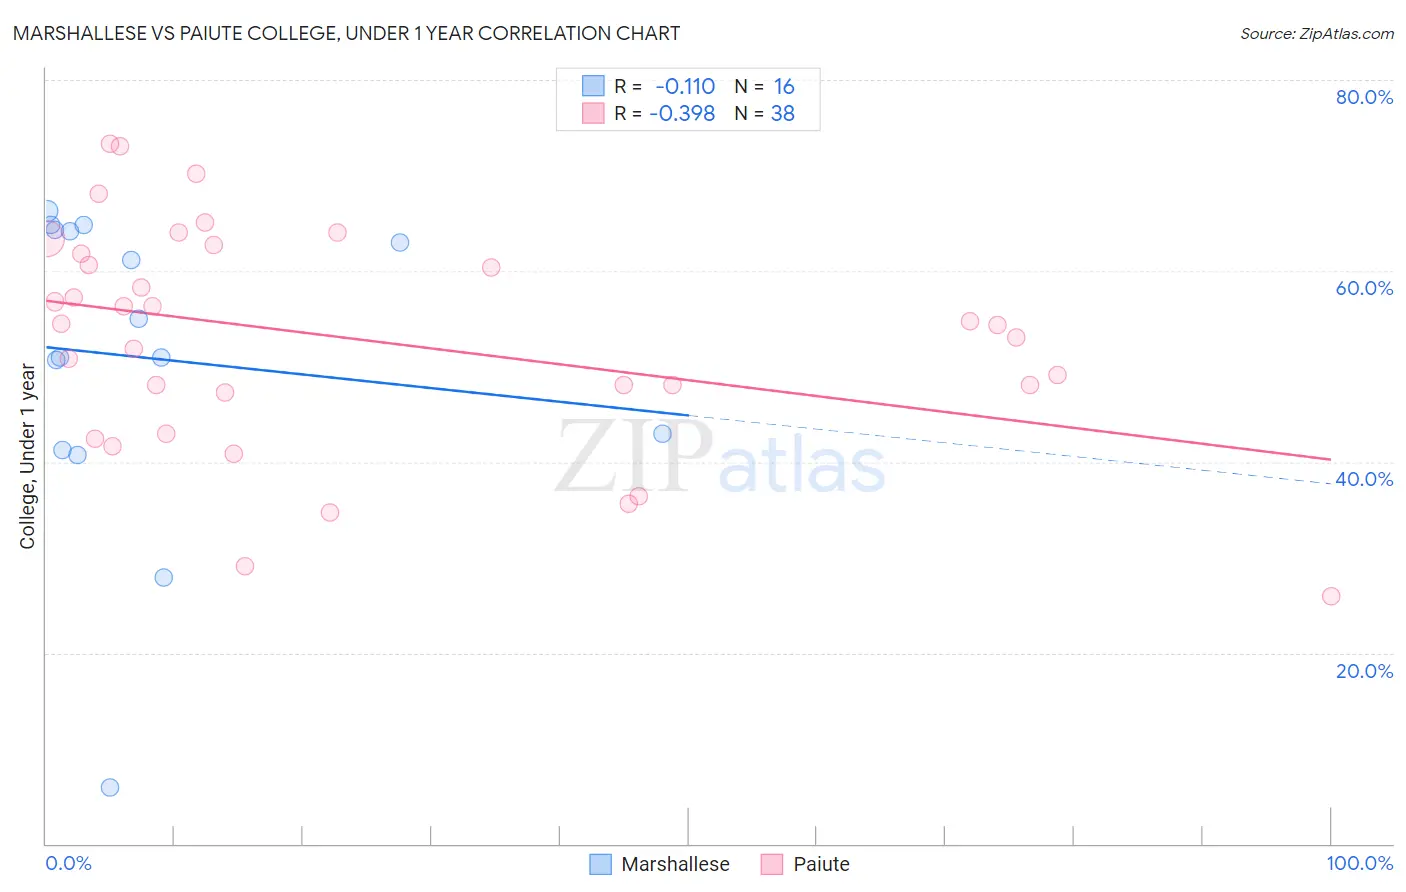
Marshallese vs Paiute College, Under 1 year Correlation Chart
The statistical analysis conducted on geographies consisting of 14,761,315 people shows a poor negative correlation between the proportion of Marshallese and percentage of population with at least college, under 1 year education in the United States with a correlation coefficient (R) of -0.110 and weighted average of 61.9%. Similarly, the statistical analysis conducted on geographies consisting of 58,404,248 people shows a mild negative correlation between the proportion of Paiute and percentage of population with at least college, under 1 year education in the United States with a correlation coefficient (R) of -0.398 and weighted average of 59.6%, a difference of 3.8%.
College, Under 1 year Correlation Summary
| Measurement | Marshallese | Paiute |
| Minimum | 5.9% | 25.9% |
| Maximum | 66.3% | 73.3% |
| Range | 60.4% | 47.4% |
| Mean | 50.9% | 52.9% |
| Median | 52.9% | 54.4% |
| Interquartile 25% (IQ1) | 42.1% | 47.3% |
| Interquartile 75% (IQ3) | 64.2% | 61.8% |
| Interquartile Range (IQR) | 22.1% | 14.5% |
| Standard Deviation (Sample) | 16.5% | 11.7% |
| Standard Deviation (Population) | 15.9% | 11.5% |
Similar Demographics by College, Under 1 year
Demographics Similar to Marshallese by College, Under 1 year
In terms of college, under 1 year, the demographic groups most similar to Marshallese are Immigrants from Liberia (61.9%, a difference of 0.020%), Delaware (62.1%, a difference of 0.22%), Potawatomi (61.8%, a difference of 0.26%), Colville (62.1%, a difference of 0.28%), and Hawaiian (62.1%, a difference of 0.37%).
| Demographics | Rating | Rank | College, Under 1 year |
| Nepalese | 1.1 /100 | #239 | Tragic 62.2% |
| Aleuts | 1.1 /100 | #240 | Tragic 62.2% |
| Ottawa | 1.1 /100 | #241 | Tragic 62.2% |
| Malaysians | 1.1 /100 | #242 | Tragic 62.2% |
| Hawaiians | 1.1 /100 | #243 | Tragic 62.1% |
| Colville | 1.0 /100 | #244 | Tragic 62.1% |
| Delaware | 0.9 /100 | #245 | Tragic 62.1% |
| Marshallese | 0.8 /100 | #246 | Tragic 61.9% |
| Immigrants | Liberia | 0.8 /100 | #247 | Tragic 61.9% |
| Potawatomi | 0.6 /100 | #248 | Tragic 61.8% |
| Vietnamese | 0.5 /100 | #249 | Tragic 61.7% |
| Immigrants | Congo | 0.5 /100 | #250 | Tragic 61.7% |
| Immigrants | Micronesia | 0.5 /100 | #251 | Tragic 61.5% |
| West Indians | 0.4 /100 | #252 | Tragic 61.5% |
| Japanese | 0.4 /100 | #253 | Tragic 61.5% |
Demographics Similar to Paiute by College, Under 1 year
In terms of college, under 1 year, the demographic groups most similar to Paiute are Immigrants from St. Vincent and the Grenadines (59.6%, a difference of 0.010%), Immigrants from Jamaica (59.7%, a difference of 0.12%), British West Indian (59.5%, a difference of 0.14%), Sioux (59.4%, a difference of 0.31%), and Black/African American (59.4%, a difference of 0.41%).
| Demographics | Rating | Rank | College, Under 1 year |
| Yaqui | 0.1 /100 | #278 | Tragic 60.2% |
| Ute | 0.1 /100 | #279 | Tragic 60.2% |
| Crow | 0.1 /100 | #280 | Tragic 60.2% |
| Cherokee | 0.1 /100 | #281 | Tragic 60.1% |
| Belizeans | 0.1 /100 | #282 | Tragic 60.1% |
| Immigrants | Jamaica | 0.0 /100 | #283 | Tragic 59.7% |
| Immigrants | St. Vincent and the Grenadines | 0.0 /100 | #284 | Tragic 59.6% |
| Paiute | 0.0 /100 | #285 | Tragic 59.6% |
| British West Indians | 0.0 /100 | #286 | Tragic 59.5% |
| Sioux | 0.0 /100 | #287 | Tragic 59.4% |
| Blacks/African Americans | 0.0 /100 | #288 | Tragic 59.4% |
| Choctaw | 0.0 /100 | #289 | Tragic 59.3% |
| Ecuadorians | 0.0 /100 | #290 | Tragic 59.3% |
| Creek | 0.0 /100 | #291 | Tragic 59.3% |
| Nicaraguans | 0.0 /100 | #292 | Tragic 59.2% |