Marshallese vs Immigrants from Egypt 4th Grade
COMPARE
Marshallese
Immigrants from Egypt
4th Grade
4th Grade Comparison
Marshallese
Immigrants from Egypt
97.6%
4TH GRADE
60.8/ 100
METRIC RATING
161st/ 347
METRIC RANK
97.4%
4TH GRADE
30.1/ 100
METRIC RATING
193rd/ 347
METRIC RANK
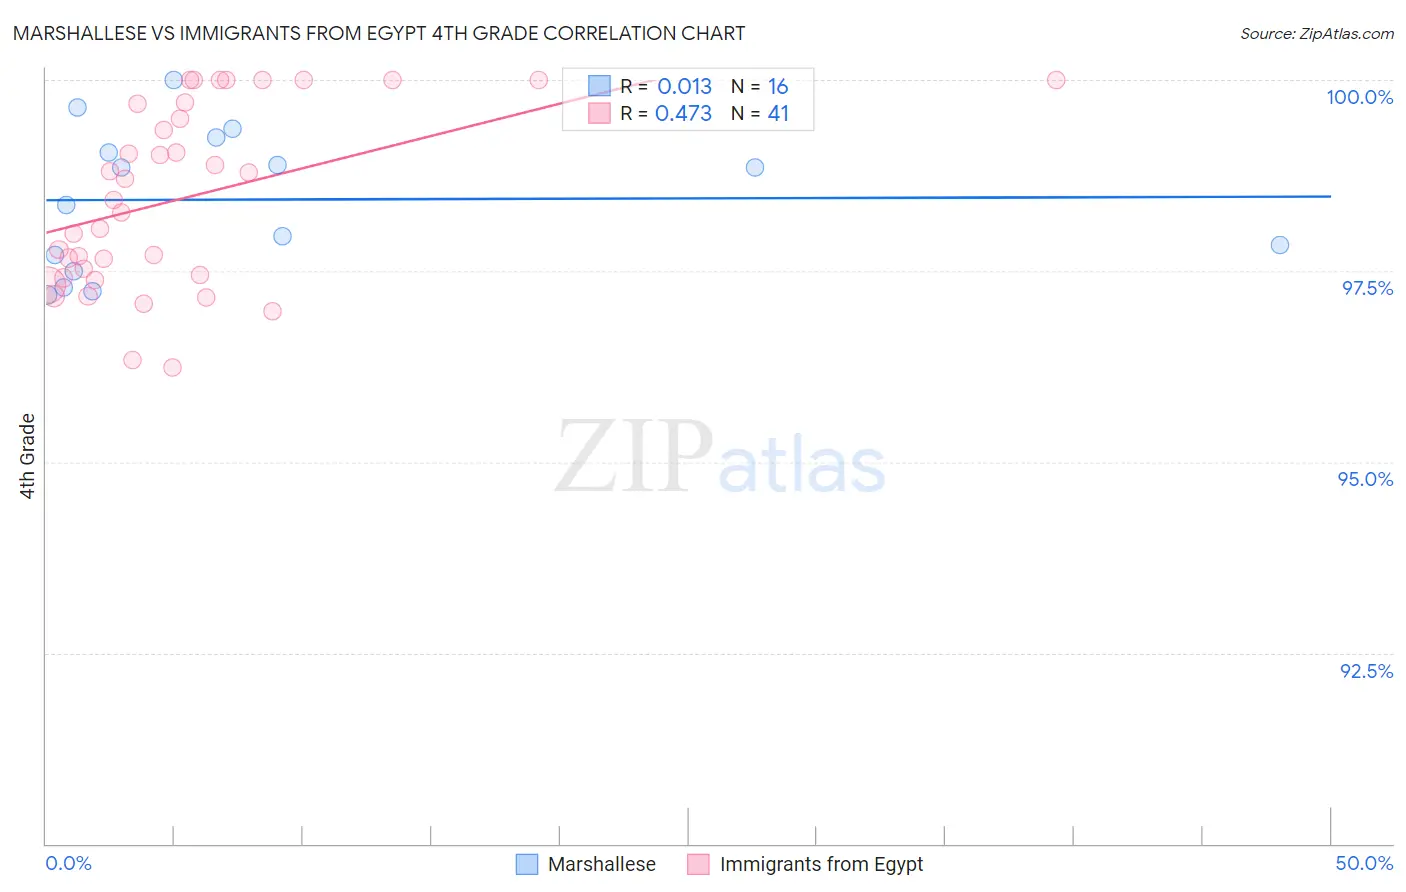
Marshallese vs Immigrants from Egypt 4th Grade Correlation Chart
The statistical analysis conducted on geographies consisting of 14,761,315 people shows no correlation between the proportion of Marshallese and percentage of population with at least 4th grade education in the United States with a correlation coefficient (R) of 0.013 and weighted average of 97.6%. Similarly, the statistical analysis conducted on geographies consisting of 245,485,794 people shows a moderate positive correlation between the proportion of Immigrants from Egypt and percentage of population with at least 4th grade education in the United States with a correlation coefficient (R) of 0.473 and weighted average of 97.4%, a difference of 0.12%.
4th Grade Correlation Summary
| Measurement | Marshallese | Immigrants from Egypt |
| Minimum | 97.2% | 96.2% |
| Maximum | 100.0% | 100.0% |
| Range | 2.8% | 3.8% |
| Mean | 98.4% | 98.5% |
| Median | 98.6% | 98.4% |
| Interquartile 25% (IQ1) | 97.6% | 97.4% |
| Interquartile 75% (IQ3) | 99.1% | 99.7% |
| Interquartile Range (IQR) | 1.5% | 2.3% |
| Standard Deviation (Sample) | 0.92% | 1.2% |
| Standard Deviation (Population) | 0.89% | 1.2% |
Similar Demographics by 4th Grade
Demographics Similar to Marshallese by 4th Grade
In terms of 4th grade, the demographic groups most similar to Marshallese are Apache (97.6%, a difference of 0.0%), Bermudan (97.6%, a difference of 0.0%), Immigrants from Iran (97.6%, a difference of 0.0%), Immigrants from Italy (97.6%, a difference of 0.010%), and Ugandan (97.6%, a difference of 0.010%).
| Demographics | Rating | Rank | 4th Grade |
| Immigrants | Russia | 67.0 /100 | #154 | Good 97.6% |
| Albanians | 67.0 /100 | #155 | Good 97.6% |
| Immigrants | Jordan | 66.9 /100 | #156 | Good 97.6% |
| Immigrants | Bosnia and Herzegovina | 66.0 /100 | #157 | Good 97.6% |
| French American Indians | 65.9 /100 | #158 | Good 97.6% |
| Immigrants | Italy | 63.7 /100 | #159 | Good 97.6% |
| Apache | 61.3 /100 | #160 | Good 97.6% |
| Marshallese | 60.8 /100 | #161 | Good 97.6% |
| Bermudans | 60.5 /100 | #162 | Good 97.6% |
| Immigrants | Iran | 60.3 /100 | #163 | Good 97.6% |
| Ugandans | 58.9 /100 | #164 | Average 97.6% |
| Venezuelans | 58.7 /100 | #165 | Average 97.6% |
| Kenyans | 56.5 /100 | #166 | Average 97.5% |
| Immigrants | Poland | 55.9 /100 | #167 | Average 97.5% |
| Immigrants | Belarus | 55.8 /100 | #168 | Average 97.5% |
Demographics Similar to Immigrants from Egypt by 4th Grade
In terms of 4th grade, the demographic groups most similar to Immigrants from Egypt are Black/African American (97.4%, a difference of 0.0%), Navajo (97.4%, a difference of 0.0%), Immigrants from Ukraine (97.4%, a difference of 0.0%), Portuguese (97.4%, a difference of 0.0%), and Panamanian (97.4%, a difference of 0.010%).
| Demographics | Rating | Rank | 4th Grade |
| Dutch West Indians | 35.8 /100 | #186 | Fair 97.5% |
| Mongolians | 34.7 /100 | #187 | Fair 97.5% |
| Immigrants | Argentina | 34.6 /100 | #188 | Fair 97.5% |
| Panamanians | 31.9 /100 | #189 | Fair 97.4% |
| Blacks/African Americans | 31.1 /100 | #190 | Fair 97.4% |
| Navajo | 30.7 /100 | #191 | Fair 97.4% |
| Immigrants | Ukraine | 30.1 /100 | #192 | Fair 97.4% |
| Immigrants | Egypt | 30.1 /100 | #193 | Fair 97.4% |
| Portuguese | 29.2 /100 | #194 | Fair 97.4% |
| Paraguayans | 28.9 /100 | #195 | Fair 97.4% |
| Immigrants | Albania | 27.7 /100 | #196 | Fair 97.4% |
| Hawaiians | 25.6 /100 | #197 | Fair 97.4% |
| Guamanians/Chamorros | 23.0 /100 | #198 | Fair 97.4% |
| Natives/Alaskans | 20.6 /100 | #199 | Fair 97.4% |
| Immigrants | Uganda | 19.8 /100 | #200 | Poor 97.4% |