Marshallese vs Menominee College, Under 1 year
COMPARE
Marshallese
Menominee
College, Under 1 year
College, Under 1 year Comparison
Marshallese
Menominee
61.9%
COLLEGE, UNDER 1 YEAR
0.8/ 100
METRIC RATING
246th/ 347
METRIC RANK
57.0%
COLLEGE, UNDER 1 YEAR
0.0/ 100
METRIC RATING
316th/ 347
METRIC RANK
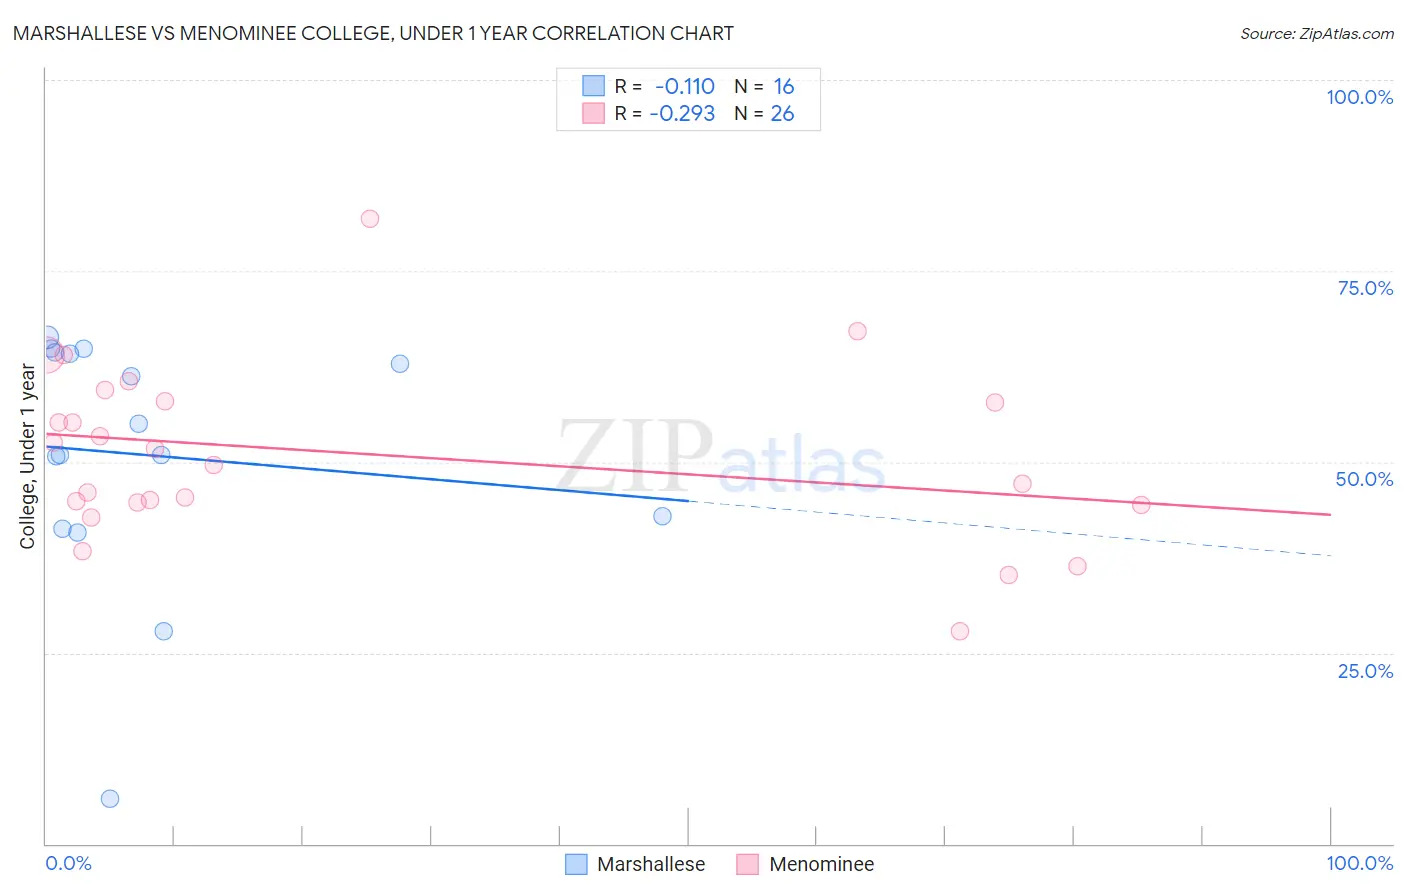
Marshallese vs Menominee College, Under 1 year Correlation Chart
The statistical analysis conducted on geographies consisting of 14,761,315 people shows a poor negative correlation between the proportion of Marshallese and percentage of population with at least college, under 1 year education in the United States with a correlation coefficient (R) of -0.110 and weighted average of 61.9%. Similarly, the statistical analysis conducted on geographies consisting of 45,778,979 people shows a weak negative correlation between the proportion of Menominee and percentage of population with at least college, under 1 year education in the United States with a correlation coefficient (R) of -0.293 and weighted average of 57.0%, a difference of 8.6%.
College, Under 1 year Correlation Summary
| Measurement | Marshallese | Menominee |
| Minimum | 5.9% | 27.9% |
| Maximum | 66.3% | 81.8% |
| Range | 60.4% | 53.9% |
| Mean | 50.9% | 51.1% |
| Median | 52.9% | 50.7% |
| Interquartile 25% (IQ1) | 42.1% | 44.6% |
| Interquartile 75% (IQ3) | 64.2% | 57.9% |
| Interquartile Range (IQR) | 22.1% | 13.3% |
| Standard Deviation (Sample) | 16.5% | 11.5% |
| Standard Deviation (Population) | 15.9% | 11.3% |
Similar Demographics by College, Under 1 year
Demographics Similar to Marshallese by College, Under 1 year
In terms of college, under 1 year, the demographic groups most similar to Marshallese are Immigrants from Liberia (61.9%, a difference of 0.020%), Delaware (62.1%, a difference of 0.22%), Potawatomi (61.8%, a difference of 0.26%), Colville (62.1%, a difference of 0.28%), and Hawaiian (62.1%, a difference of 0.37%).
| Demographics | Rating | Rank | College, Under 1 year |
| Nepalese | 1.1 /100 | #239 | Tragic 62.2% |
| Aleuts | 1.1 /100 | #240 | Tragic 62.2% |
| Ottawa | 1.1 /100 | #241 | Tragic 62.2% |
| Malaysians | 1.1 /100 | #242 | Tragic 62.2% |
| Hawaiians | 1.1 /100 | #243 | Tragic 62.1% |
| Colville | 1.0 /100 | #244 | Tragic 62.1% |
| Delaware | 0.9 /100 | #245 | Tragic 62.1% |
| Marshallese | 0.8 /100 | #246 | Tragic 61.9% |
| Immigrants | Liberia | 0.8 /100 | #247 | Tragic 61.9% |
| Potawatomi | 0.6 /100 | #248 | Tragic 61.8% |
| Vietnamese | 0.5 /100 | #249 | Tragic 61.7% |
| Immigrants | Congo | 0.5 /100 | #250 | Tragic 61.7% |
| Immigrants | Micronesia | 0.5 /100 | #251 | Tragic 61.5% |
| West Indians | 0.4 /100 | #252 | Tragic 61.5% |
| Japanese | 0.4 /100 | #253 | Tragic 61.5% |
Demographics Similar to Menominee by College, Under 1 year
In terms of college, under 1 year, the demographic groups most similar to Menominee are Hispanic or Latino (57.0%, a difference of 0.040%), Honduran (57.1%, a difference of 0.050%), Hopi (57.1%, a difference of 0.10%), Immigrants from Haiti (56.9%, a difference of 0.16%), and Dutch West Indian (57.2%, a difference of 0.22%).
| Demographics | Rating | Rank | College, Under 1 year |
| Immigrants | Nicaragua | 0.0 /100 | #309 | Tragic 57.6% |
| Pueblo | 0.0 /100 | #310 | Tragic 57.4% |
| Cajuns | 0.0 /100 | #311 | Tragic 57.3% |
| Salvadorans | 0.0 /100 | #312 | Tragic 57.3% |
| Dutch West Indians | 0.0 /100 | #313 | Tragic 57.2% |
| Hopi | 0.0 /100 | #314 | Tragic 57.1% |
| Hondurans | 0.0 /100 | #315 | Tragic 57.1% |
| Menominee | 0.0 /100 | #316 | Tragic 57.0% |
| Hispanics or Latinos | 0.0 /100 | #317 | Tragic 57.0% |
| Immigrants | Haiti | 0.0 /100 | #318 | Tragic 56.9% |
| Puerto Ricans | 0.0 /100 | #319 | Tragic 56.8% |
| Guatemalans | 0.0 /100 | #320 | Tragic 56.8% |
| Natives/Alaskans | 0.0 /100 | #321 | Tragic 56.6% |
| Immigrants | Caribbean | 0.0 /100 | #322 | Tragic 56.6% |
| Immigrants | Honduras | 0.0 /100 | #323 | Tragic 56.5% |