Yakama vs Immigrants from Egypt College, Under 1 year
COMPARE
Yakama
Immigrants from Egypt
College, Under 1 year
College, Under 1 year Comparison
Yakama
Immigrants from Egypt
52.6%
COLLEGE, UNDER 1 YEAR
0.0/ 100
METRIC RATING
344th/ 347
METRIC RANK
67.7%
COLLEGE, UNDER 1 YEAR
96.0/ 100
METRIC RATING
108th/ 347
METRIC RANK
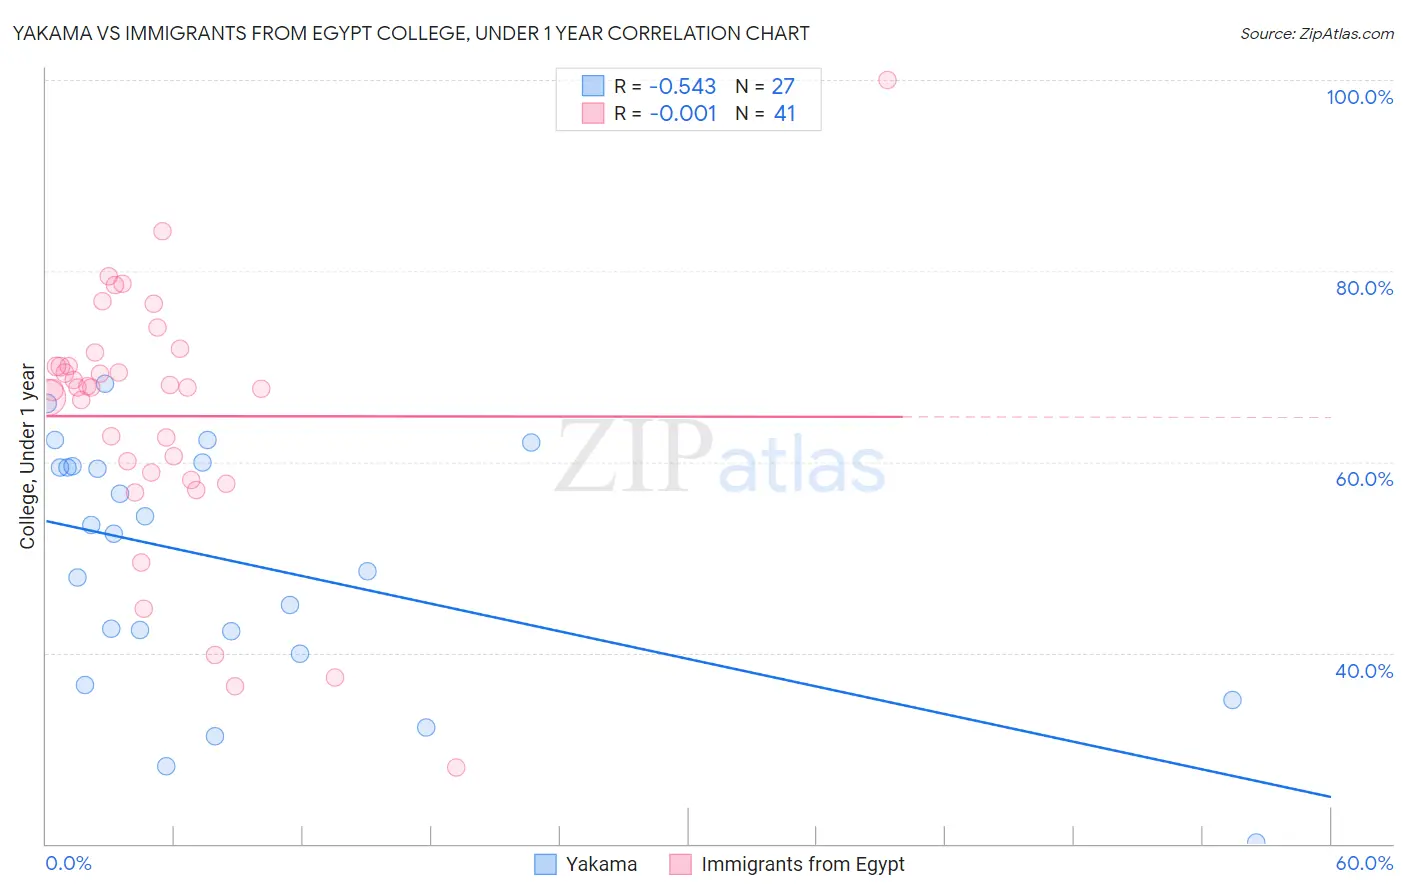
Yakama vs Immigrants from Egypt College, Under 1 year Correlation Chart
The statistical analysis conducted on geographies consisting of 19,923,144 people shows a substantial negative correlation between the proportion of Yakama and percentage of population with at least college, under 1 year education in the United States with a correlation coefficient (R) of -0.543 and weighted average of 52.6%. Similarly, the statistical analysis conducted on geographies consisting of 245,485,794 people shows no correlation between the proportion of Immigrants from Egypt and percentage of population with at least college, under 1 year education in the United States with a correlation coefficient (R) of -0.001 and weighted average of 67.7%, a difference of 28.6%.
College, Under 1 year Correlation Summary
| Measurement | Yakama | Immigrants from Egypt |
| Minimum | 20.2% | 28.0% |
| Maximum | 68.2% | 100.0% |
| Range | 48.1% | 72.0% |
| Mean | 49.2% | 64.8% |
| Median | 52.5% | 67.8% |
| Interquartile 25% (IQ1) | 40.0% | 58.6% |
| Interquartile 75% (IQ3) | 59.5% | 70.7% |
| Interquartile Range (IQR) | 19.6% | 12.1% |
| Standard Deviation (Sample) | 12.8% | 13.6% |
| Standard Deviation (Population) | 12.6% | 13.4% |
Similar Demographics by College, Under 1 year
Demographics Similar to Yakama by College, Under 1 year
In terms of college, under 1 year, the demographic groups most similar to Yakama are Tohono O'odham (52.8%, a difference of 0.30%), Immigrants from Mexico (53.7%, a difference of 1.9%), Immigrants from Cabo Verde (53.7%, a difference of 2.0%), Pima (51.4%, a difference of 2.4%), and Spanish American Indian (54.0%, a difference of 2.5%).
| Demographics | Rating | Rank | College, Under 1 year |
| Yuman | 0.0 /100 | #333 | Tragic 55.1% |
| Immigrants | Azores | 0.0 /100 | #334 | Tragic 54.7% |
| Inupiat | 0.0 /100 | #335 | Tragic 54.6% |
| Pennsylvania Germans | 0.0 /100 | #336 | Tragic 54.5% |
| Immigrants | Central America | 0.0 /100 | #337 | Tragic 54.4% |
| Lumbee | 0.0 /100 | #338 | Tragic 54.2% |
| Immigrants | Dominican Republic | 0.0 /100 | #339 | Tragic 54.0% |
| Spanish American Indians | 0.0 /100 | #340 | Tragic 54.0% |
| Immigrants | Cabo Verde | 0.0 /100 | #341 | Tragic 53.7% |
| Immigrants | Mexico | 0.0 /100 | #342 | Tragic 53.7% |
| Tohono O'odham | 0.0 /100 | #343 | Tragic 52.8% |
| Yakama | 0.0 /100 | #344 | Tragic 52.6% |
| Pima | 0.0 /100 | #345 | Tragic 51.4% |
| Houma | 0.0 /100 | #346 | Tragic 47.6% |
| Yup'ik | 0.0 /100 | #347 | Tragic 45.8% |
Demographics Similar to Immigrants from Egypt by College, Under 1 year
In terms of college, under 1 year, the demographic groups most similar to Immigrants from Egypt are Scandinavian (67.7%, a difference of 0.060%), Assyrian/Chaldean/Syriac (67.7%, a difference of 0.060%), Ukrainian (67.7%, a difference of 0.060%), Macedonian (67.6%, a difference of 0.080%), and Syrian (67.6%, a difference of 0.11%).
| Demographics | Rating | Rank | College, Under 1 year |
| Immigrants | Eastern Europe | 96.9 /100 | #101 | Exceptional 67.9% |
| Palestinians | 96.9 /100 | #102 | Exceptional 67.9% |
| Carpatho Rusyns | 96.8 /100 | #103 | Exceptional 67.9% |
| Immigrants | Western Asia | 96.6 /100 | #104 | Exceptional 67.8% |
| Afghans | 96.6 /100 | #105 | Exceptional 67.8% |
| Immigrants | Croatia | 96.6 /100 | #106 | Exceptional 67.8% |
| Austrians | 96.4 /100 | #107 | Exceptional 67.8% |
| Immigrants | Egypt | 96.0 /100 | #108 | Exceptional 67.7% |
| Scandinavians | 95.8 /100 | #109 | Exceptional 67.7% |
| Assyrians/Chaldeans/Syriacs | 95.8 /100 | #110 | Exceptional 67.7% |
| Ukrainians | 95.8 /100 | #111 | Exceptional 67.7% |
| Macedonians | 95.7 /100 | #112 | Exceptional 67.6% |
| Syrians | 95.6 /100 | #113 | Exceptional 67.6% |
| Chileans | 95.3 /100 | #114 | Exceptional 67.6% |
| Basques | 95.2 /100 | #115 | Exceptional 67.6% |