Lumbee vs Uruguayan Doctorate Degree
COMPARE
Lumbee
Uruguayan
Doctorate Degree
Doctorate Degree Comparison
Lumbee
Uruguayans
1.1%
DOCTORATE DEGREE
0.0/ 100
METRIC RATING
345th/ 347
METRIC RANK
1.8%
DOCTORATE DEGREE
26.2/ 100
METRIC RATING
194th/ 347
METRIC RANK
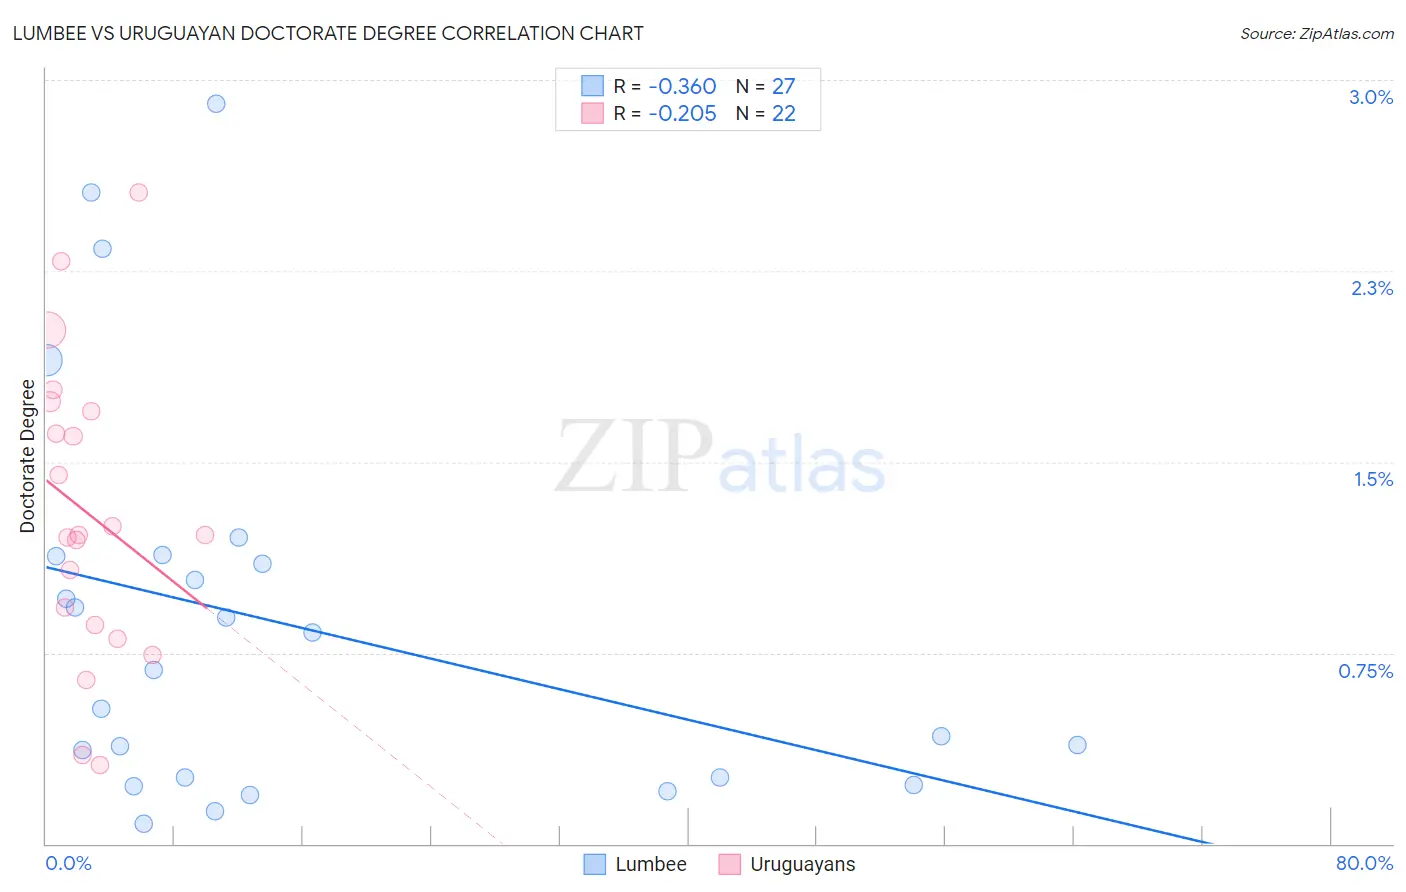
Lumbee vs Uruguayan Doctorate Degree Correlation Chart
The statistical analysis conducted on geographies consisting of 91,789,296 people shows a mild negative correlation between the proportion of Lumbee and percentage of population with at least doctorate degree education in the United States with a correlation coefficient (R) of -0.360 and weighted average of 1.1%. Similarly, the statistical analysis conducted on geographies consisting of 144,575,670 people shows a weak negative correlation between the proportion of Uruguayans and percentage of population with at least doctorate degree education in the United States with a correlation coefficient (R) of -0.205 and weighted average of 1.8%, a difference of 62.4%.
Doctorate Degree Correlation Summary
| Measurement | Lumbee | Uruguayan |
| Minimum | 0.076% | 0.31% |
| Maximum | 2.9% | 2.6% |
| Range | 2.8% | 2.2% |
| Mean | 0.86% | 1.3% |
| Median | 0.68% | 1.2% |
| Interquartile 25% (IQ1) | 0.26% | 0.86% |
| Interquartile 75% (IQ3) | 1.1% | 1.7% |
| Interquartile Range (IQR) | 0.87% | 0.84% |
| Standard Deviation (Sample) | 0.77% | 0.58% |
| Standard Deviation (Population) | 0.75% | 0.57% |
Similar Demographics by Doctorate Degree
Demographics Similar to Lumbee by Doctorate Degree
In terms of doctorate degree, the demographic groups most similar to Lumbee are Immigrants from Mexico (1.1%, a difference of 1.5%), Spanish American Indian (1.1%, a difference of 2.8%), Fijian (1.1%, a difference of 3.6%), Arapaho (1.2%, a difference of 7.1%), and Mexican (1.2%, a difference of 7.5%).
| Demographics | Rating | Rank | Doctorate Degree |
| Immigrants | Caribbean | 0.0 /100 | #333 | Tragic 1.3% |
| Immigrants | Dominican Republic | 0.0 /100 | #334 | Tragic 1.3% |
| Immigrants | Haiti | 0.0 /100 | #335 | Tragic 1.3% |
| Nepalese | 0.0 /100 | #336 | Tragic 1.3% |
| Bangladeshis | 0.0 /100 | #337 | Tragic 1.2% |
| Puget Sound Salish | 0.0 /100 | #338 | Tragic 1.2% |
| Immigrants | Central America | 0.0 /100 | #339 | Tragic 1.2% |
| Immigrants | Cuba | 0.0 /100 | #340 | Tragic 1.2% |
| Mexicans | 0.0 /100 | #341 | Tragic 1.2% |
| Arapaho | 0.0 /100 | #342 | Tragic 1.2% |
| Fijians | 0.0 /100 | #343 | Tragic 1.1% |
| Immigrants | Mexico | 0.0 /100 | #344 | Tragic 1.1% |
| Lumbee | 0.0 /100 | #345 | Tragic 1.1% |
| Spanish American Indians | 0.0 /100 | #346 | Tragic 1.1% |
| Houma | 0.0 /100 | #347 | Tragic 0.96% |
Demographics Similar to Uruguayans by Doctorate Degree
In terms of doctorate degree, the demographic groups most similar to Uruguayans are Immigrants from Somalia (1.8%, a difference of 0.15%), German Russian (1.8%, a difference of 0.17%), Subsaharan African (1.8%, a difference of 0.22%), Chinese (1.8%, a difference of 0.23%), and Dutch (1.8%, a difference of 0.24%).
| Demographics | Rating | Rank | Doctorate Degree |
| Czechoslovakians | 33.0 /100 | #187 | Fair 1.8% |
| Germans | 30.5 /100 | #188 | Fair 1.8% |
| French Canadians | 30.2 /100 | #189 | Fair 1.8% |
| Immigrants | Costa Rica | 30.2 /100 | #190 | Fair 1.8% |
| South Americans | 29.5 /100 | #191 | Fair 1.8% |
| Dutch | 27.4 /100 | #192 | Fair 1.8% |
| German Russians | 27.1 /100 | #193 | Fair 1.8% |
| Uruguayans | 26.2 /100 | #194 | Fair 1.8% |
| Immigrants | Somalia | 25.4 /100 | #195 | Fair 1.8% |
| Sub-Saharan Africans | 25.1 /100 | #196 | Fair 1.8% |
| Chinese | 25.1 /100 | #197 | Fair 1.8% |
| Immigrants | Ghana | 24.6 /100 | #198 | Fair 1.8% |
| Immigrants | South America | 23.3 /100 | #199 | Fair 1.8% |
| Whites/Caucasians | 22.8 /100 | #200 | Fair 1.8% |
| Immigrants | Nigeria | 22.4 /100 | #201 | Fair 1.8% |