Lumbee vs Ecuadorian Doctorate Degree
COMPARE
Lumbee
Ecuadorian
Doctorate Degree
Doctorate Degree Comparison
Lumbee
Ecuadorians
1.1%
DOCTORATE DEGREE
0.0/ 100
METRIC RATING
345th/ 347
METRIC RANK
1.5%
DOCTORATE DEGREE
0.4/ 100
METRIC RATING
280th/ 347
METRIC RANK
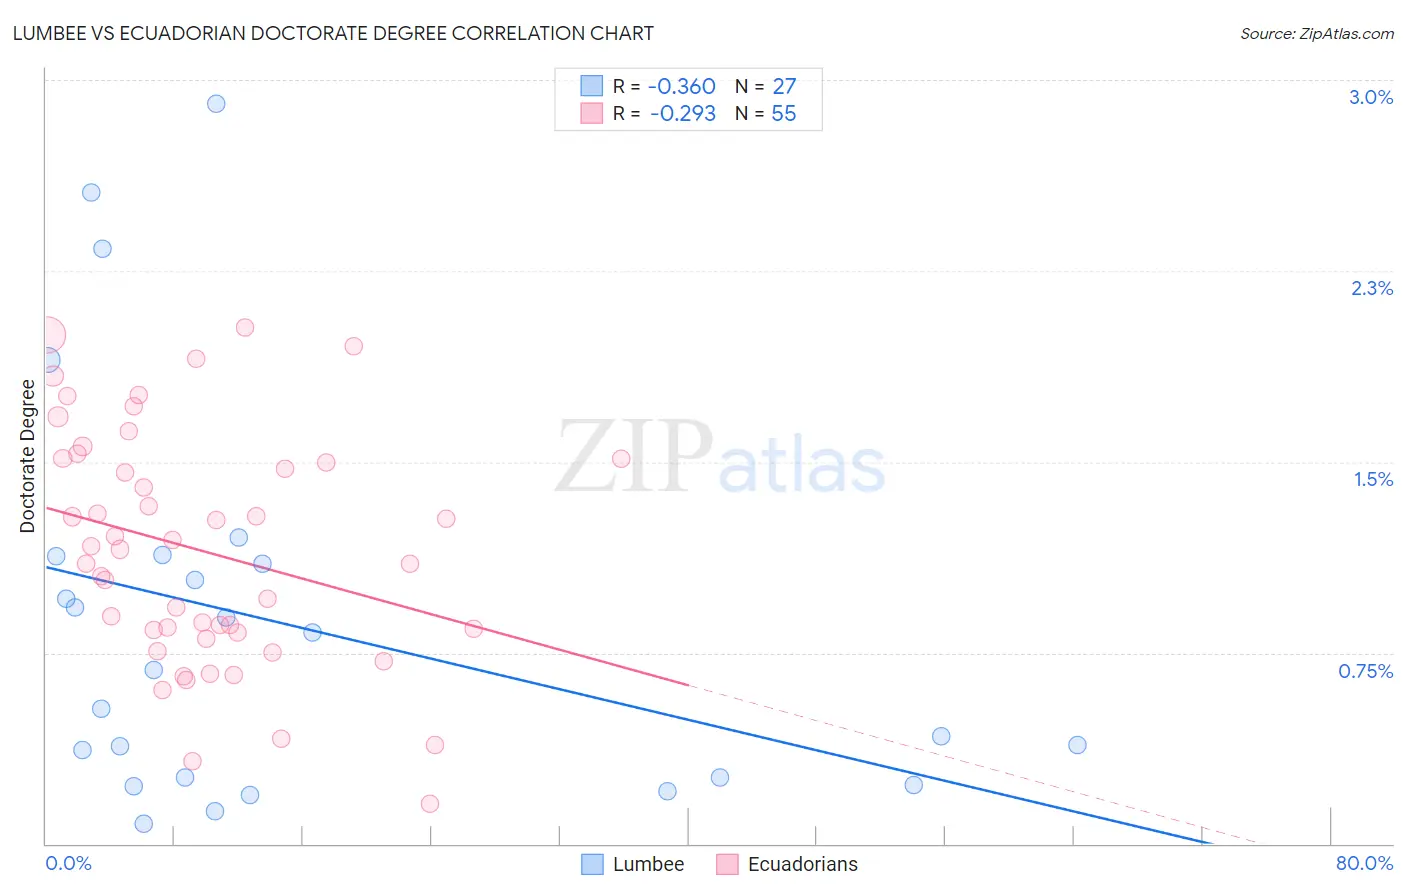
Lumbee vs Ecuadorian Doctorate Degree Correlation Chart
The statistical analysis conducted on geographies consisting of 91,789,296 people shows a mild negative correlation between the proportion of Lumbee and percentage of population with at least doctorate degree education in the United States with a correlation coefficient (R) of -0.360 and weighted average of 1.1%. Similarly, the statistical analysis conducted on geographies consisting of 316,205,329 people shows a weak negative correlation between the proportion of Ecuadorians and percentage of population with at least doctorate degree education in the United States with a correlation coefficient (R) of -0.293 and weighted average of 1.5%, a difference of 33.9%.
Doctorate Degree Correlation Summary
| Measurement | Lumbee | Ecuadorian |
| Minimum | 0.076% | 0.16% |
| Maximum | 2.9% | 2.0% |
| Range | 2.8% | 1.9% |
| Mean | 0.86% | 1.1% |
| Median | 0.68% | 1.2% |
| Interquartile 25% (IQ1) | 0.26% | 0.83% |
| Interquartile 75% (IQ3) | 1.1% | 1.5% |
| Interquartile Range (IQR) | 0.87% | 0.68% |
| Standard Deviation (Sample) | 0.77% | 0.46% |
| Standard Deviation (Population) | 0.75% | 0.45% |
Similar Demographics by Doctorate Degree
Demographics Similar to Lumbee by Doctorate Degree
In terms of doctorate degree, the demographic groups most similar to Lumbee are Immigrants from Mexico (1.1%, a difference of 1.5%), Spanish American Indian (1.1%, a difference of 2.8%), Fijian (1.1%, a difference of 3.6%), Arapaho (1.2%, a difference of 7.1%), and Mexican (1.2%, a difference of 7.5%).
| Demographics | Rating | Rank | Doctorate Degree |
| Immigrants | Caribbean | 0.0 /100 | #333 | Tragic 1.3% |
| Immigrants | Dominican Republic | 0.0 /100 | #334 | Tragic 1.3% |
| Immigrants | Haiti | 0.0 /100 | #335 | Tragic 1.3% |
| Nepalese | 0.0 /100 | #336 | Tragic 1.3% |
| Bangladeshis | 0.0 /100 | #337 | Tragic 1.2% |
| Puget Sound Salish | 0.0 /100 | #338 | Tragic 1.2% |
| Immigrants | Central America | 0.0 /100 | #339 | Tragic 1.2% |
| Immigrants | Cuba | 0.0 /100 | #340 | Tragic 1.2% |
| Mexicans | 0.0 /100 | #341 | Tragic 1.2% |
| Arapaho | 0.0 /100 | #342 | Tragic 1.2% |
| Fijians | 0.0 /100 | #343 | Tragic 1.1% |
| Immigrants | Mexico | 0.0 /100 | #344 | Tragic 1.1% |
| Lumbee | 0.0 /100 | #345 | Tragic 1.1% |
| Spanish American Indians | 0.0 /100 | #346 | Tragic 1.1% |
| Houma | 0.0 /100 | #347 | Tragic 0.96% |
Demographics Similar to Ecuadorians by Doctorate Degree
In terms of doctorate degree, the demographic groups most similar to Ecuadorians are Marshallese (1.5%, a difference of 0.010%), Tohono O'odham (1.5%, a difference of 0.060%), British West Indian (1.5%, a difference of 0.12%), Central American (1.5%, a difference of 0.16%), and Jamaican (1.5%, a difference of 0.20%).
| Demographics | Rating | Rank | Doctorate Degree |
| Sioux | 0.4 /100 | #273 | Tragic 1.5% |
| Yaqui | 0.4 /100 | #274 | Tragic 1.5% |
| Aleuts | 0.4 /100 | #275 | Tragic 1.5% |
| Paiute | 0.4 /100 | #276 | Tragic 1.5% |
| Bahamians | 0.4 /100 | #277 | Tragic 1.5% |
| Hawaiians | 0.4 /100 | #278 | Tragic 1.5% |
| Marshallese | 0.4 /100 | #279 | Tragic 1.5% |
| Ecuadorians | 0.4 /100 | #280 | Tragic 1.5% |
| Tohono O'odham | 0.4 /100 | #281 | Tragic 1.5% |
| British West Indians | 0.3 /100 | #282 | Tragic 1.5% |
| Central Americans | 0.3 /100 | #283 | Tragic 1.5% |
| Jamaicans | 0.3 /100 | #284 | Tragic 1.5% |
| Malaysians | 0.3 /100 | #285 | Tragic 1.5% |
| Cherokee | 0.3 /100 | #286 | Tragic 1.5% |
| Cajuns | 0.3 /100 | #287 | Tragic 1.5% |