Lumbee vs Chickasaw Doctorate Degree
COMPARE
Lumbee
Chickasaw
Doctorate Degree
Doctorate Degree Comparison
Lumbee
Chickasaw
1.1%
DOCTORATE DEGREE
0.0/ 100
METRIC RATING
345th/ 347
METRIC RANK
1.5%
DOCTORATE DEGREE
0.7/ 100
METRIC RATING
262nd/ 347
METRIC RANK
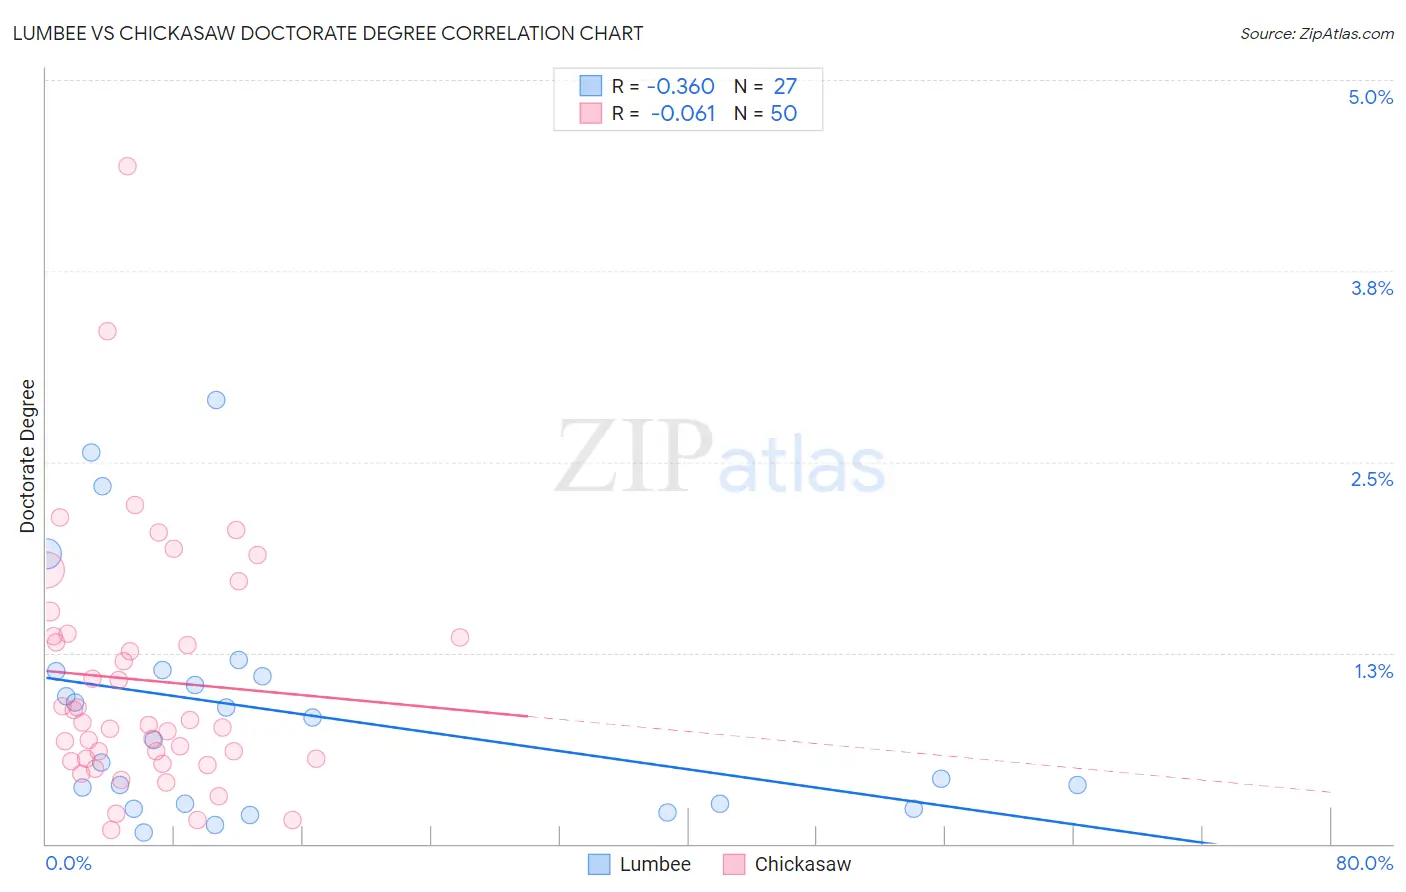
Lumbee vs Chickasaw Doctorate Degree Correlation Chart
The statistical analysis conducted on geographies consisting of 91,789,296 people shows a mild negative correlation between the proportion of Lumbee and percentage of population with at least doctorate degree education in the United States with a correlation coefficient (R) of -0.360 and weighted average of 1.1%. Similarly, the statistical analysis conducted on geographies consisting of 146,327,093 people shows a slight negative correlation between the proportion of Chickasaw and percentage of population with at least doctorate degree education in the United States with a correlation coefficient (R) of -0.061 and weighted average of 1.5%, a difference of 38.6%.
Doctorate Degree Correlation Summary
| Measurement | Lumbee | Chickasaw |
| Minimum | 0.076% | 0.090% |
| Maximum | 2.9% | 4.4% |
| Range | 2.8% | 4.3% |
| Mean | 0.86% | 1.1% |
| Median | 0.68% | 0.79% |
| Interquartile 25% (IQ1) | 0.26% | 0.56% |
| Interquartile 75% (IQ3) | 1.1% | 1.4% |
| Interquartile Range (IQR) | 0.87% | 0.80% |
| Standard Deviation (Sample) | 0.77% | 0.82% |
| Standard Deviation (Population) | 0.75% | 0.81% |
Similar Demographics by Doctorate Degree
Demographics Similar to Lumbee by Doctorate Degree
In terms of doctorate degree, the demographic groups most similar to Lumbee are Immigrants from Mexico (1.1%, a difference of 1.5%), Spanish American Indian (1.1%, a difference of 2.8%), Fijian (1.1%, a difference of 3.6%), Arapaho (1.2%, a difference of 7.1%), and Mexican (1.2%, a difference of 7.5%).
| Demographics | Rating | Rank | Doctorate Degree |
| Immigrants | Caribbean | 0.0 /100 | #333 | Tragic 1.3% |
| Immigrants | Dominican Republic | 0.0 /100 | #334 | Tragic 1.3% |
| Immigrants | Haiti | 0.0 /100 | #335 | Tragic 1.3% |
| Nepalese | 0.0 /100 | #336 | Tragic 1.3% |
| Bangladeshis | 0.0 /100 | #337 | Tragic 1.2% |
| Puget Sound Salish | 0.0 /100 | #338 | Tragic 1.2% |
| Immigrants | Central America | 0.0 /100 | #339 | Tragic 1.2% |
| Immigrants | Cuba | 0.0 /100 | #340 | Tragic 1.2% |
| Mexicans | 0.0 /100 | #341 | Tragic 1.2% |
| Arapaho | 0.0 /100 | #342 | Tragic 1.2% |
| Fijians | 0.0 /100 | #343 | Tragic 1.1% |
| Immigrants | Mexico | 0.0 /100 | #344 | Tragic 1.1% |
| Lumbee | 0.0 /100 | #345 | Tragic 1.1% |
| Spanish American Indians | 0.0 /100 | #346 | Tragic 1.1% |
| Houma | 0.0 /100 | #347 | Tragic 0.96% |
Demographics Similar to Chickasaw by Doctorate Degree
In terms of doctorate degree, the demographic groups most similar to Chickasaw are Immigrants from Portugal (1.5%, a difference of 0.15%), Immigrants from Bahamas (1.5%, a difference of 0.17%), Blackfeet (1.5%, a difference of 0.36%), Japanese (1.5%, a difference of 0.61%), and Nicaraguan (1.5%, a difference of 0.64%).
| Demographics | Rating | Rank | Doctorate Degree |
| Trinidadians and Tobagonians | 1.0 /100 | #255 | Tragic 1.5% |
| Central American Indians | 1.0 /100 | #256 | Tragic 1.5% |
| Chippewa | 0.9 /100 | #257 | Tragic 1.5% |
| Immigrants | West Indies | 0.9 /100 | #258 | Tragic 1.5% |
| Liberians | 0.9 /100 | #259 | Tragic 1.5% |
| Japanese | 0.9 /100 | #260 | Tragic 1.5% |
| Immigrants | Portugal | 0.8 /100 | #261 | Tragic 1.5% |
| Chickasaw | 0.7 /100 | #262 | Tragic 1.5% |
| Immigrants | Bahamas | 0.7 /100 | #263 | Tragic 1.5% |
| Blackfeet | 0.7 /100 | #264 | Tragic 1.5% |
| Nicaraguans | 0.6 /100 | #265 | Tragic 1.5% |
| Immigrants | Liberia | 0.5 /100 | #266 | Tragic 1.5% |
| Kiowa | 0.5 /100 | #267 | Tragic 1.5% |
| U.S. Virgin Islanders | 0.5 /100 | #268 | Tragic 1.5% |
| Crow | 0.5 /100 | #269 | Tragic 1.5% |