Venezuelan vs Uruguayan Doctorate Degree
COMPARE
Venezuelan
Uruguayan
Doctorate Degree
Doctorate Degree Comparison
Venezuelans
Uruguayans
1.7%
DOCTORATE DEGREE
19.5/ 100
METRIC RATING
205th/ 347
METRIC RANK
1.8%
DOCTORATE DEGREE
26.2/ 100
METRIC RATING
194th/ 347
METRIC RANK
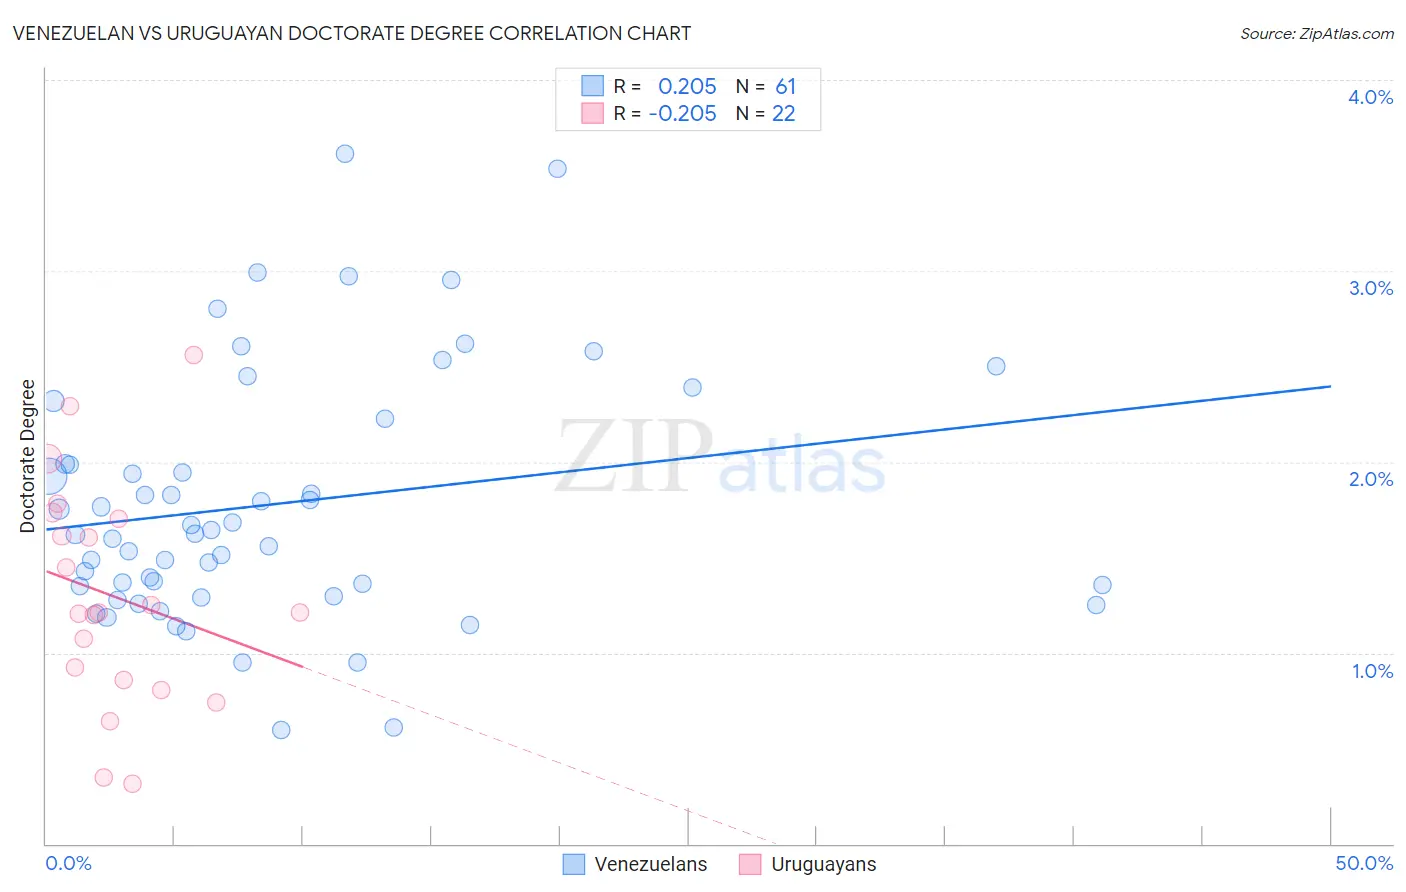
Venezuelan vs Uruguayan Doctorate Degree Correlation Chart
The statistical analysis conducted on geographies consisting of 304,663,259 people shows a weak positive correlation between the proportion of Venezuelans and percentage of population with at least doctorate degree education in the United States with a correlation coefficient (R) of 0.205 and weighted average of 1.7%. Similarly, the statistical analysis conducted on geographies consisting of 144,575,670 people shows a weak negative correlation between the proportion of Uruguayans and percentage of population with at least doctorate degree education in the United States with a correlation coefficient (R) of -0.205 and weighted average of 1.8%, a difference of 1.5%.
Doctorate Degree Correlation Summary
| Measurement | Venezuelan | Uruguayan |
| Minimum | 0.59% | 0.31% |
| Maximum | 3.6% | 2.6% |
| Range | 3.0% | 2.2% |
| Mean | 1.8% | 1.3% |
| Median | 1.6% | 1.2% |
| Interquartile 25% (IQ1) | 1.3% | 0.86% |
| Interquartile 75% (IQ3) | 2.1% | 1.7% |
| Interquartile Range (IQR) | 0.78% | 0.84% |
| Standard Deviation (Sample) | 0.66% | 0.58% |
| Standard Deviation (Population) | 0.65% | 0.57% |
Demographics Similar to Venezuelans and Uruguayans by Doctorate Degree
In terms of doctorate degree, the demographic groups most similar to Venezuelans are Somali (1.7%, a difference of 0.41%), Immigrants from Vietnam (1.8%, a difference of 0.44%), Portuguese (1.8%, a difference of 0.46%), Immigrants from Peru (1.7%, a difference of 0.48%), and Yugoslavian (1.7%, a difference of 0.64%). Similarly, the demographic groups most similar to Uruguayans are Immigrants from Somalia (1.8%, a difference of 0.15%), German Russian (1.8%, a difference of 0.17%), Subsaharan African (1.8%, a difference of 0.22%), Chinese (1.8%, a difference of 0.23%), and Dutch (1.8%, a difference of 0.24%).
| Demographics | Rating | Rank | Doctorate Degree |
| French Canadians | 30.2 /100 | #189 | Fair 1.8% |
| Immigrants | Costa Rica | 30.2 /100 | #190 | Fair 1.8% |
| South Americans | 29.5 /100 | #191 | Fair 1.8% |
| Dutch | 27.4 /100 | #192 | Fair 1.8% |
| German Russians | 27.1 /100 | #193 | Fair 1.8% |
| Uruguayans | 26.2 /100 | #194 | Fair 1.8% |
| Immigrants | Somalia | 25.4 /100 | #195 | Fair 1.8% |
| Sub-Saharan Africans | 25.1 /100 | #196 | Fair 1.8% |
| Chinese | 25.1 /100 | #197 | Fair 1.8% |
| Immigrants | Ghana | 24.6 /100 | #198 | Fair 1.8% |
| Immigrants | South America | 23.3 /100 | #199 | Fair 1.8% |
| Whites/Caucasians | 22.8 /100 | #200 | Fair 1.8% |
| Immigrants | Nigeria | 22.4 /100 | #201 | Fair 1.8% |
| Portuguese | 21.4 /100 | #202 | Fair 1.8% |
| Immigrants | Vietnam | 21.4 /100 | #203 | Fair 1.8% |
| Somalis | 21.2 /100 | #204 | Fair 1.7% |
| Venezuelans | 19.5 /100 | #205 | Poor 1.7% |
| Immigrants | Peru | 17.6 /100 | #206 | Poor 1.7% |
| Yugoslavians | 17.1 /100 | #207 | Poor 1.7% |
| Colombians | 16.1 /100 | #208 | Poor 1.7% |
| Immigrants | Western Africa | 15.4 /100 | #209 | Poor 1.7% |