Slovak vs Uruguayan Doctorate Degree
COMPARE
Slovak
Uruguayan
Doctorate Degree
Doctorate Degree Comparison
Slovaks
Uruguayans
1.8%
DOCTORATE DEGREE
36.4/ 100
METRIC RATING
185th/ 347
METRIC RANK
1.8%
DOCTORATE DEGREE
26.2/ 100
METRIC RATING
194th/ 347
METRIC RANK
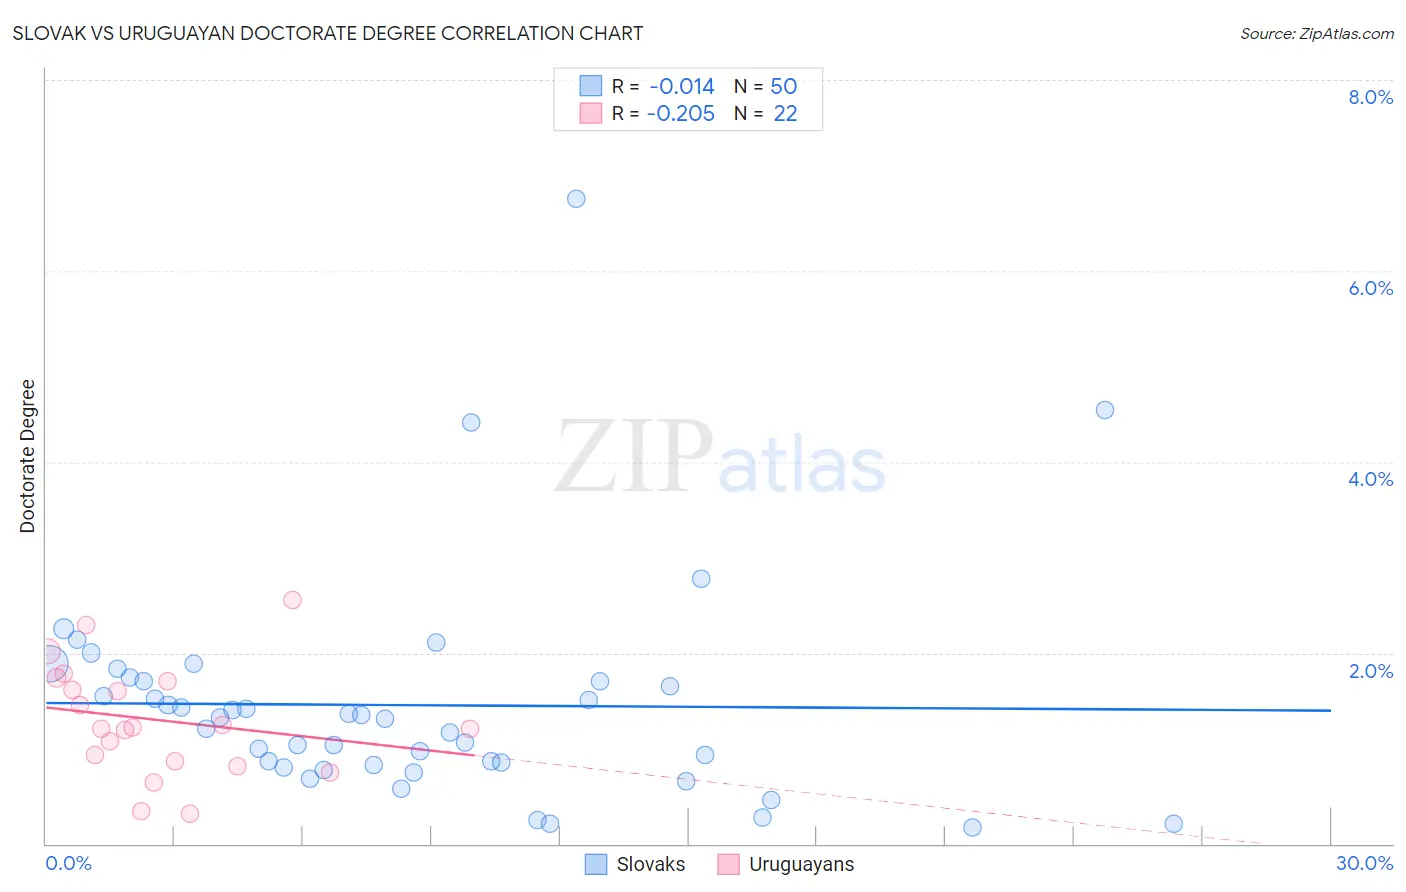
Slovak vs Uruguayan Doctorate Degree Correlation Chart
The statistical analysis conducted on geographies consisting of 392,855,228 people shows no correlation between the proportion of Slovaks and percentage of population with at least doctorate degree education in the United States with a correlation coefficient (R) of -0.014 and weighted average of 1.8%. Similarly, the statistical analysis conducted on geographies consisting of 144,575,670 people shows a weak negative correlation between the proportion of Uruguayans and percentage of population with at least doctorate degree education in the United States with a correlation coefficient (R) of -0.205 and weighted average of 1.8%, a difference of 1.8%.
Doctorate Degree Correlation Summary
| Measurement | Slovak | Uruguayan |
| Minimum | 0.17% | 0.31% |
| Maximum | 6.8% | 2.6% |
| Range | 6.6% | 2.2% |
| Mean | 1.5% | 1.3% |
| Median | 1.3% | 1.2% |
| Interquartile 25% (IQ1) | 0.83% | 0.86% |
| Interquartile 75% (IQ3) | 1.7% | 1.7% |
| Interquartile Range (IQR) | 0.88% | 0.84% |
| Standard Deviation (Sample) | 1.2% | 0.58% |
| Standard Deviation (Population) | 1.1% | 0.57% |
Demographics Similar to Slovaks and Uruguayans by Doctorate Degree
In terms of doctorate degree, the demographic groups most similar to Slovaks are Peruvian (1.8%, a difference of 0.32%), Czechoslovakian (1.8%, a difference of 0.55%), Nigerian (1.8%, a difference of 0.57%), Finnish (1.8%, a difference of 0.90%), and German (1.8%, a difference of 1.0%). Similarly, the demographic groups most similar to Uruguayans are Immigrants from Somalia (1.8%, a difference of 0.15%), German Russian (1.8%, a difference of 0.17%), Subsaharan African (1.8%, a difference of 0.22%), Chinese (1.8%, a difference of 0.23%), and Dutch (1.8%, a difference of 0.24%).
| Demographics | Rating | Rank | Doctorate Degree |
| Ghanaians | 48.3 /100 | #179 | Average 1.8% |
| Scandinavians | 48.0 /100 | #180 | Average 1.8% |
| Immigrants | Immigrants | 46.2 /100 | #181 | Average 1.8% |
| Immigrants | Afghanistan | 44.3 /100 | #182 | Average 1.8% |
| Finns | 42.1 /100 | #183 | Average 1.8% |
| Nigerians | 39.9 /100 | #184 | Fair 1.8% |
| Slovaks | 36.4 /100 | #185 | Fair 1.8% |
| Peruvians | 34.4 /100 | #186 | Fair 1.8% |
| Czechoslovakians | 33.0 /100 | #187 | Fair 1.8% |
| Germans | 30.5 /100 | #188 | Fair 1.8% |
| French Canadians | 30.2 /100 | #189 | Fair 1.8% |
| Immigrants | Costa Rica | 30.2 /100 | #190 | Fair 1.8% |
| South Americans | 29.5 /100 | #191 | Fair 1.8% |
| Dutch | 27.4 /100 | #192 | Fair 1.8% |
| German Russians | 27.1 /100 | #193 | Fair 1.8% |
| Uruguayans | 26.2 /100 | #194 | Fair 1.8% |
| Immigrants | Somalia | 25.4 /100 | #195 | Fair 1.8% |
| Sub-Saharan Africans | 25.1 /100 | #196 | Fair 1.8% |
| Chinese | 25.1 /100 | #197 | Fair 1.8% |
| Immigrants | Ghana | 24.6 /100 | #198 | Fair 1.8% |
| Immigrants | South America | 23.3 /100 | #199 | Fair 1.8% |