Lumbee vs Danish Doctorate Degree
COMPARE
Lumbee
Danish
Doctorate Degree
Doctorate Degree Comparison
Lumbee
Danes
1.1%
DOCTORATE DEGREE
0.0/ 100
METRIC RATING
345th/ 347
METRIC RANK
1.9%
DOCTORATE DEGREE
71.9/ 100
METRIC RATING
157th/ 347
METRIC RANK
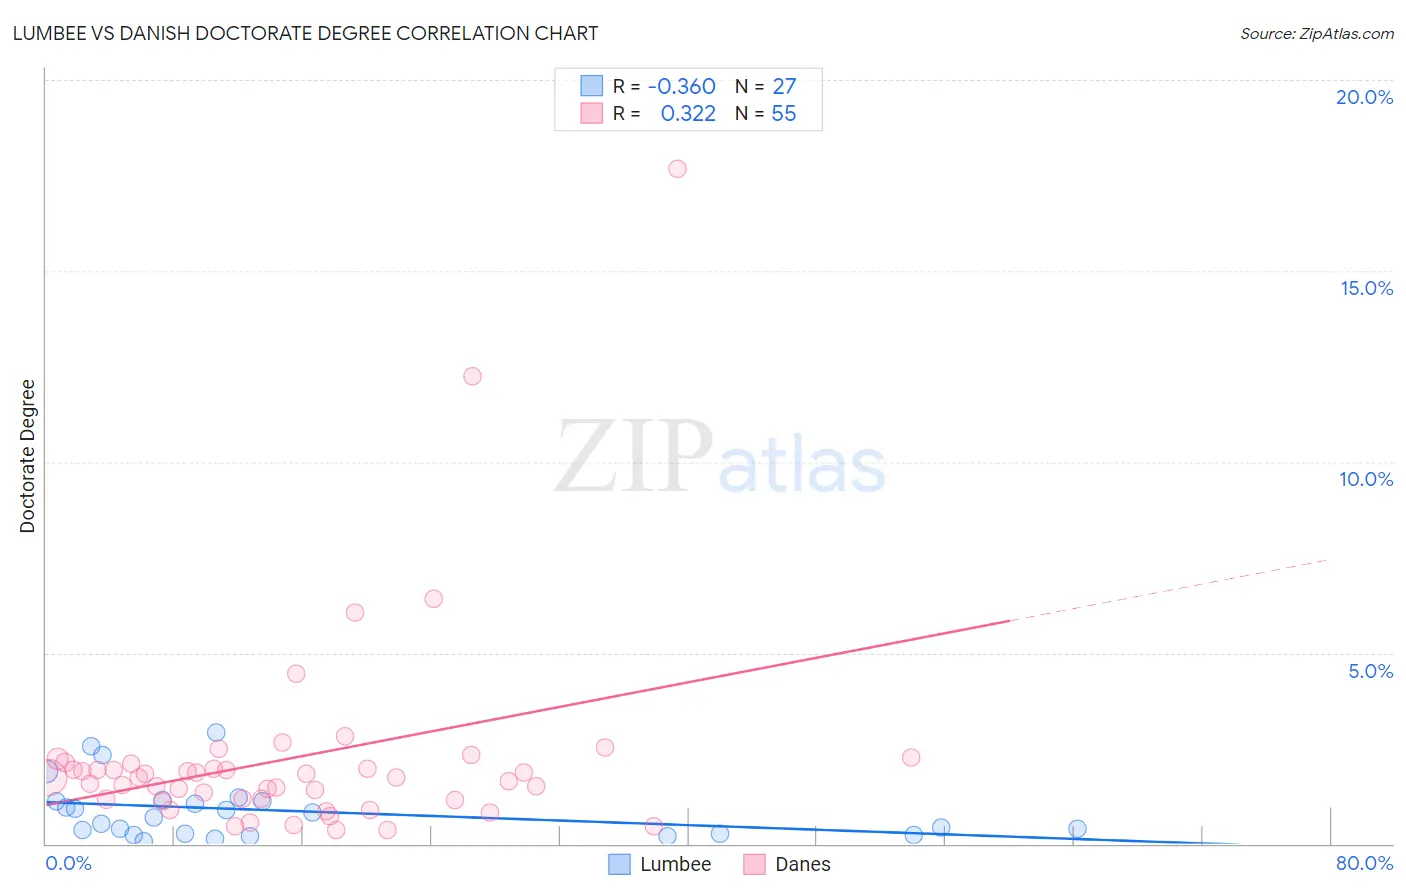
Lumbee vs Danish Doctorate Degree Correlation Chart
The statistical analysis conducted on geographies consisting of 91,789,296 people shows a mild negative correlation between the proportion of Lumbee and percentage of population with at least doctorate degree education in the United States with a correlation coefficient (R) of -0.360 and weighted average of 1.1%. Similarly, the statistical analysis conducted on geographies consisting of 464,600,564 people shows a mild positive correlation between the proportion of Danes and percentage of population with at least doctorate degree education in the United States with a correlation coefficient (R) of 0.322 and weighted average of 1.9%, a difference of 74.6%.
Doctorate Degree Correlation Summary
| Measurement | Lumbee | Danish |
| Minimum | 0.076% | 0.36% |
| Maximum | 2.9% | 17.7% |
| Range | 2.8% | 17.3% |
| Mean | 0.86% | 2.3% |
| Median | 0.68% | 1.7% |
| Interquartile 25% (IQ1) | 0.26% | 1.2% |
| Interquartile 75% (IQ3) | 1.1% | 2.1% |
| Interquartile Range (IQR) | 0.87% | 0.94% |
| Standard Deviation (Sample) | 0.77% | 2.8% |
| Standard Deviation (Population) | 0.75% | 2.8% |
Similar Demographics by Doctorate Degree
Demographics Similar to Lumbee by Doctorate Degree
In terms of doctorate degree, the demographic groups most similar to Lumbee are Immigrants from Mexico (1.1%, a difference of 1.5%), Spanish American Indian (1.1%, a difference of 2.8%), Fijian (1.1%, a difference of 3.6%), Arapaho (1.2%, a difference of 7.1%), and Mexican (1.2%, a difference of 7.5%).
| Demographics | Rating | Rank | Doctorate Degree |
| Immigrants | Caribbean | 0.0 /100 | #333 | Tragic 1.3% |
| Immigrants | Dominican Republic | 0.0 /100 | #334 | Tragic 1.3% |
| Immigrants | Haiti | 0.0 /100 | #335 | Tragic 1.3% |
| Nepalese | 0.0 /100 | #336 | Tragic 1.3% |
| Bangladeshis | 0.0 /100 | #337 | Tragic 1.2% |
| Puget Sound Salish | 0.0 /100 | #338 | Tragic 1.2% |
| Immigrants | Central America | 0.0 /100 | #339 | Tragic 1.2% |
| Immigrants | Cuba | 0.0 /100 | #340 | Tragic 1.2% |
| Mexicans | 0.0 /100 | #341 | Tragic 1.2% |
| Arapaho | 0.0 /100 | #342 | Tragic 1.2% |
| Fijians | 0.0 /100 | #343 | Tragic 1.1% |
| Immigrants | Mexico | 0.0 /100 | #344 | Tragic 1.1% |
| Lumbee | 0.0 /100 | #345 | Tragic 1.1% |
| Spanish American Indians | 0.0 /100 | #346 | Tragic 1.1% |
| Houma | 0.0 /100 | #347 | Tragic 0.96% |
Demographics Similar to Danes by Doctorate Degree
In terms of doctorate degree, the demographic groups most similar to Danes are Hungarian (1.9%, a difference of 0.030%), Slavic (1.9%, a difference of 0.090%), Polish (1.9%, a difference of 0.14%), Immigrants from Albania (1.9%, a difference of 0.16%), and Slovene (1.9%, a difference of 0.29%).
| Demographics | Rating | Rank | Doctorate Degree |
| English | 75.9 /100 | #150 | Good 1.9% |
| Albanians | 74.8 /100 | #151 | Good 1.9% |
| Immigrants | Kenya | 74.3 /100 | #152 | Good 1.9% |
| Immigrants | Oceania | 74.0 /100 | #153 | Good 1.9% |
| Immigrants | Albania | 72.8 /100 | #154 | Good 1.9% |
| Poles | 72.7 /100 | #155 | Good 1.9% |
| Slavs | 72.4 /100 | #156 | Good 1.9% |
| Danes | 71.9 /100 | #157 | Good 1.9% |
| Hungarians | 71.7 /100 | #158 | Good 1.9% |
| Slovenes | 70.2 /100 | #159 | Good 1.9% |
| Welsh | 69.7 /100 | #160 | Good 1.9% |
| Immigrants | Middle Africa | 68.8 /100 | #161 | Good 1.9% |
| Irish | 67.5 /100 | #162 | Good 1.9% |
| Czechs | 67.3 /100 | #163 | Good 1.9% |
| Celtics | 66.7 /100 | #164 | Good 1.9% |