Lumbee vs Swedish Doctorate Degree
COMPARE
Lumbee
Swedish
Doctorate Degree
Doctorate Degree Comparison
Lumbee
Swedes
1.1%
DOCTORATE DEGREE
0.0/ 100
METRIC RATING
345th/ 347
METRIC RANK
2.0%
DOCTORATE DEGREE
88.3/ 100
METRIC RATING
136th/ 347
METRIC RANK
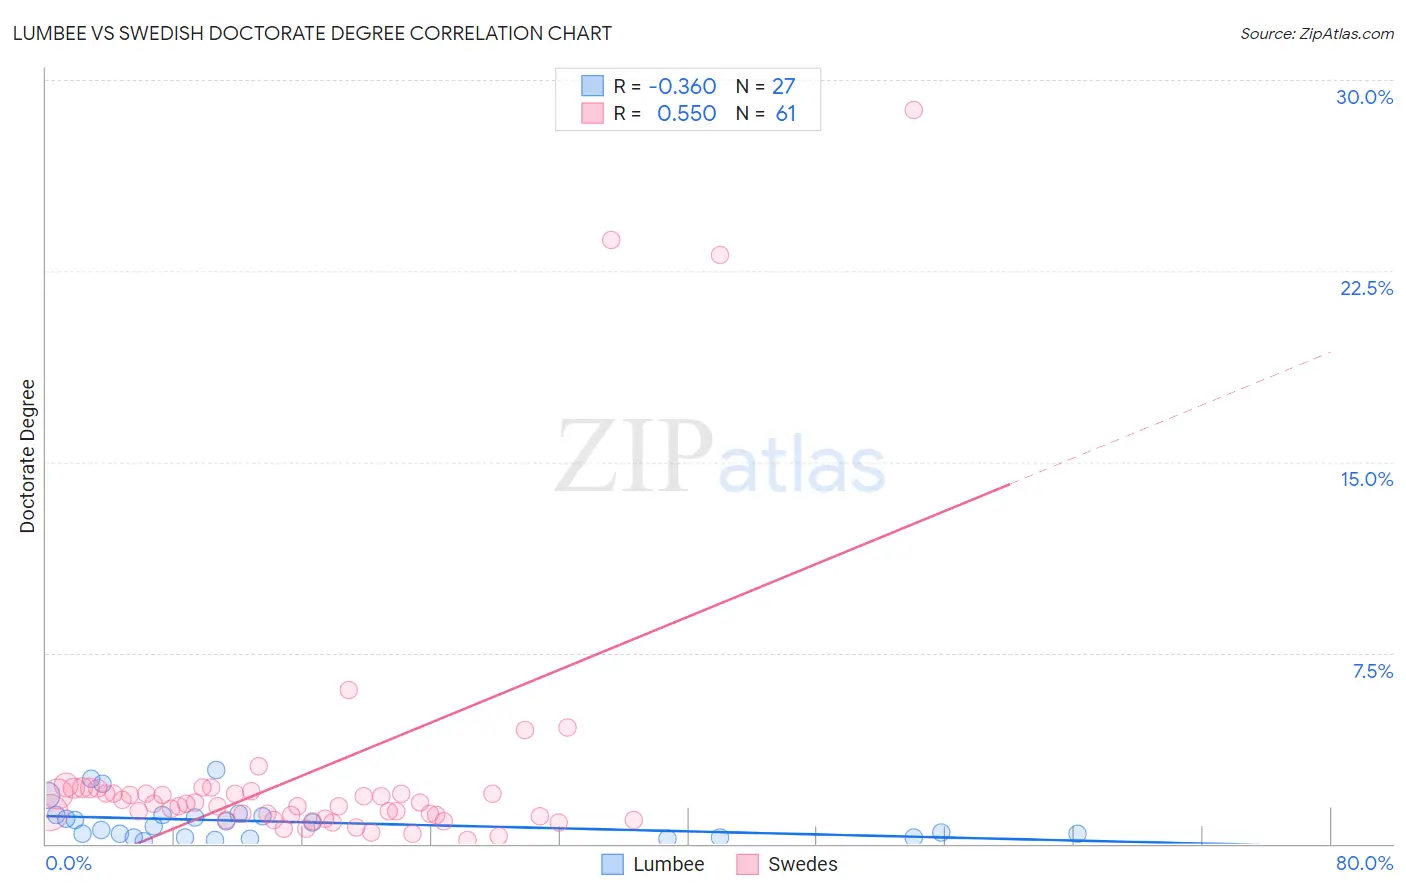
Lumbee vs Swedish Doctorate Degree Correlation Chart
The statistical analysis conducted on geographies consisting of 91,789,296 people shows a mild negative correlation between the proportion of Lumbee and percentage of population with at least doctorate degree education in the United States with a correlation coefficient (R) of -0.360 and weighted average of 1.1%. Similarly, the statistical analysis conducted on geographies consisting of 521,864,669 people shows a substantial positive correlation between the proportion of Swedes and percentage of population with at least doctorate degree education in the United States with a correlation coefficient (R) of 0.550 and weighted average of 2.0%, a difference of 81.3%.
Doctorate Degree Correlation Summary
| Measurement | Lumbee | Swedish |
| Minimum | 0.076% | 0.16% |
| Maximum | 2.9% | 28.8% |
| Range | 2.8% | 28.6% |
| Mean | 0.86% | 2.8% |
| Median | 0.68% | 1.6% |
| Interquartile 25% (IQ1) | 0.26% | 1.0% |
| Interquartile 75% (IQ3) | 1.1% | 2.0% |
| Interquartile Range (IQR) | 0.87% | 0.98% |
| Standard Deviation (Sample) | 0.77% | 5.3% |
| Standard Deviation (Population) | 0.75% | 5.2% |
Similar Demographics by Doctorate Degree
Demographics Similar to Lumbee by Doctorate Degree
In terms of doctorate degree, the demographic groups most similar to Lumbee are Immigrants from Mexico (1.1%, a difference of 1.5%), Spanish American Indian (1.1%, a difference of 2.8%), Fijian (1.1%, a difference of 3.6%), Arapaho (1.2%, a difference of 7.1%), and Mexican (1.2%, a difference of 7.5%).
| Demographics | Rating | Rank | Doctorate Degree |
| Immigrants | Caribbean | 0.0 /100 | #333 | Tragic 1.3% |
| Immigrants | Dominican Republic | 0.0 /100 | #334 | Tragic 1.3% |
| Immigrants | Haiti | 0.0 /100 | #335 | Tragic 1.3% |
| Nepalese | 0.0 /100 | #336 | Tragic 1.3% |
| Bangladeshis | 0.0 /100 | #337 | Tragic 1.2% |
| Puget Sound Salish | 0.0 /100 | #338 | Tragic 1.2% |
| Immigrants | Central America | 0.0 /100 | #339 | Tragic 1.2% |
| Immigrants | Cuba | 0.0 /100 | #340 | Tragic 1.2% |
| Mexicans | 0.0 /100 | #341 | Tragic 1.2% |
| Arapaho | 0.0 /100 | #342 | Tragic 1.2% |
| Fijians | 0.0 /100 | #343 | Tragic 1.1% |
| Immigrants | Mexico | 0.0 /100 | #344 | Tragic 1.1% |
| Lumbee | 0.0 /100 | #345 | Tragic 1.1% |
| Spanish American Indians | 0.0 /100 | #346 | Tragic 1.1% |
| Houma | 0.0 /100 | #347 | Tragic 0.96% |
Demographics Similar to Swedes by Doctorate Degree
In terms of doctorate degree, the demographic groups most similar to Swedes are South American Indian (2.0%, a difference of 0.0%), Swiss (2.0%, a difference of 0.10%), Serbian (2.0%, a difference of 0.14%), Immigrants from Cameroon (2.0%, a difference of 0.21%), and Afghan (2.0%, a difference of 0.32%).
| Demographics | Rating | Rank | Doctorate Degree |
| Canadians | 90.6 /100 | #129 | Exceptional 2.0% |
| Immigrants | Ukraine | 90.5 /100 | #130 | Exceptional 2.0% |
| Immigrants | Sierra Leone | 90.2 /100 | #131 | Exceptional 2.0% |
| Scottish | 89.4 /100 | #132 | Excellent 2.0% |
| Immigrants | Uzbekistan | 89.3 /100 | #133 | Excellent 2.0% |
| Immigrants | Cameroon | 88.9 /100 | #134 | Excellent 2.0% |
| Serbians | 88.7 /100 | #135 | Excellent 2.0% |
| Swedes | 88.3 /100 | #136 | Excellent 2.0% |
| South American Indians | 88.3 /100 | #137 | Excellent 2.0% |
| Swiss | 88.0 /100 | #138 | Excellent 2.0% |
| Afghans | 87.2 /100 | #139 | Excellent 2.0% |
| Immigrants | Africa | 87.0 /100 | #140 | Excellent 2.0% |
| Senegalese | 86.7 /100 | #141 | Excellent 2.0% |
| Italians | 86.0 /100 | #142 | Excellent 2.0% |
| Sierra Leoneans | 85.1 /100 | #143 | Excellent 2.0% |