Lumbee vs Immigrants from Uganda Doctorate Degree
COMPARE
Lumbee
Immigrants from Uganda
Doctorate Degree
Doctorate Degree Comparison
Lumbee
Immigrants from Uganda
1.1%
DOCTORATE DEGREE
0.0/ 100
METRIC RATING
345th/ 347
METRIC RANK
2.2%
DOCTORATE DEGREE
99.6/ 100
METRIC RATING
82nd/ 347
METRIC RANK
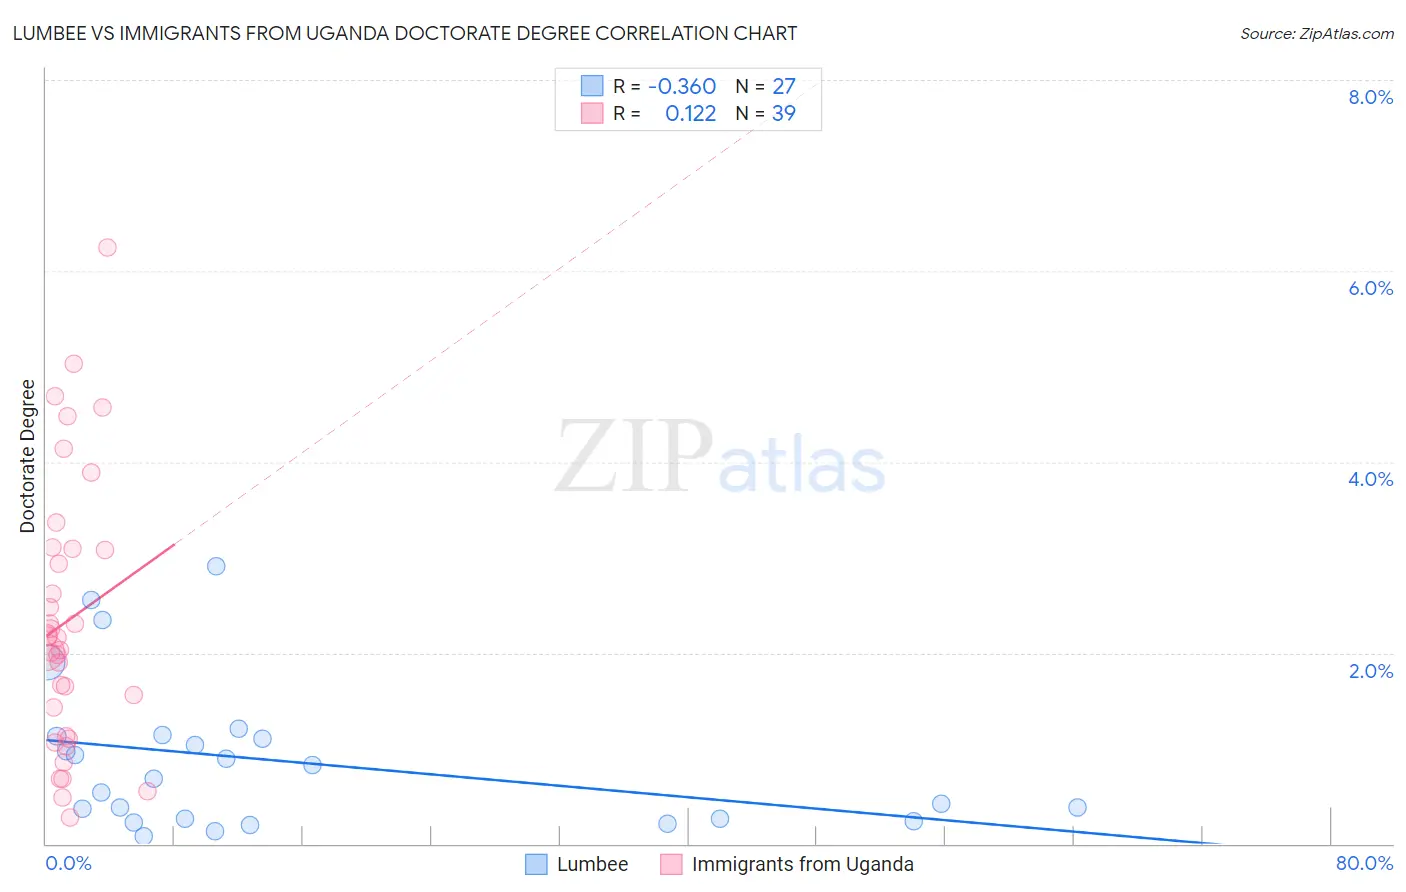
Lumbee vs Immigrants from Uganda Doctorate Degree Correlation Chart
The statistical analysis conducted on geographies consisting of 91,789,296 people shows a mild negative correlation between the proportion of Lumbee and percentage of population with at least doctorate degree education in the United States with a correlation coefficient (R) of -0.360 and weighted average of 1.1%. Similarly, the statistical analysis conducted on geographies consisting of 125,795,140 people shows a poor positive correlation between the proportion of Immigrants from Uganda and percentage of population with at least doctorate degree education in the United States with a correlation coefficient (R) of 0.122 and weighted average of 2.2%, a difference of 103.2%.
Doctorate Degree Correlation Summary
| Measurement | Lumbee | Immigrants from Uganda |
| Minimum | 0.076% | 0.28% |
| Maximum | 2.9% | 6.2% |
| Range | 2.8% | 6.0% |
| Mean | 0.86% | 2.3% |
| Median | 0.68% | 2.2% |
| Interquartile 25% (IQ1) | 0.26% | 1.1% |
| Interquartile 75% (IQ3) | 1.1% | 3.1% |
| Interquartile Range (IQR) | 0.87% | 2.0% |
| Standard Deviation (Sample) | 0.77% | 1.4% |
| Standard Deviation (Population) | 0.75% | 1.4% |
Similar Demographics by Doctorate Degree
Demographics Similar to Lumbee by Doctorate Degree
In terms of doctorate degree, the demographic groups most similar to Lumbee are Immigrants from Mexico (1.1%, a difference of 1.5%), Spanish American Indian (1.1%, a difference of 2.8%), Fijian (1.1%, a difference of 3.6%), Arapaho (1.2%, a difference of 7.1%), and Mexican (1.2%, a difference of 7.5%).
| Demographics | Rating | Rank | Doctorate Degree |
| Immigrants | Caribbean | 0.0 /100 | #333 | Tragic 1.3% |
| Immigrants | Dominican Republic | 0.0 /100 | #334 | Tragic 1.3% |
| Immigrants | Haiti | 0.0 /100 | #335 | Tragic 1.3% |
| Nepalese | 0.0 /100 | #336 | Tragic 1.3% |
| Bangladeshis | 0.0 /100 | #337 | Tragic 1.2% |
| Puget Sound Salish | 0.0 /100 | #338 | Tragic 1.2% |
| Immigrants | Central America | 0.0 /100 | #339 | Tragic 1.2% |
| Immigrants | Cuba | 0.0 /100 | #340 | Tragic 1.2% |
| Mexicans | 0.0 /100 | #341 | Tragic 1.2% |
| Arapaho | 0.0 /100 | #342 | Tragic 1.2% |
| Fijians | 0.0 /100 | #343 | Tragic 1.1% |
| Immigrants | Mexico | 0.0 /100 | #344 | Tragic 1.1% |
| Lumbee | 0.0 /100 | #345 | Tragic 1.1% |
| Spanish American Indians | 0.0 /100 | #346 | Tragic 1.1% |
| Houma | 0.0 /100 | #347 | Tragic 0.96% |
Demographics Similar to Immigrants from Uganda by Doctorate Degree
In terms of doctorate degree, the demographic groups most similar to Immigrants from Uganda are Immigrants from Lithuania (2.2%, a difference of 0.17%), Immigrants from England (2.2%, a difference of 0.32%), Immigrants from Brazil (2.2%, a difference of 0.45%), Immigrants from Argentina (2.2%, a difference of 0.54%), and Ugandan (2.2%, a difference of 0.59%).
| Demographics | Rating | Rank | Doctorate Degree |
| Immigrants | Western Asia | 99.8 /100 | #75 | Exceptional 2.2% |
| Immigrants | Hungary | 99.8 /100 | #76 | Exceptional 2.2% |
| Immigrants | Lebanon | 99.8 /100 | #77 | Exceptional 2.2% |
| Immigrants | Belarus | 99.7 /100 | #78 | Exceptional 2.2% |
| Northern Europeans | 99.7 /100 | #79 | Exceptional 2.2% |
| Ugandans | 99.7 /100 | #80 | Exceptional 2.2% |
| Immigrants | Argentina | 99.7 /100 | #81 | Exceptional 2.2% |
| Immigrants | Uganda | 99.6 /100 | #82 | Exceptional 2.2% |
| Immigrants | Lithuania | 99.6 /100 | #83 | Exceptional 2.2% |
| Immigrants | England | 99.6 /100 | #84 | Exceptional 2.2% |
| Immigrants | Brazil | 99.6 /100 | #85 | Exceptional 2.2% |
| Egyptians | 99.4 /100 | #86 | Exceptional 2.2% |
| Immigrants | Zimbabwe | 99.4 /100 | #87 | Exceptional 2.2% |
| Immigrants | Nepal | 99.3 /100 | #88 | Exceptional 2.2% |
| British | 99.3 /100 | #89 | Exceptional 2.2% |