Lumbee vs Immigrants from North Macedonia Doctorate Degree
COMPARE
Lumbee
Immigrants from North Macedonia
Doctorate Degree
Doctorate Degree Comparison
Lumbee
Immigrants from North Macedonia
1.1%
DOCTORATE DEGREE
0.0/ 100
METRIC RATING
345th/ 347
METRIC RANK
1.6%
DOCTORATE DEGREE
3.9/ 100
METRIC RATING
231st/ 347
METRIC RANK
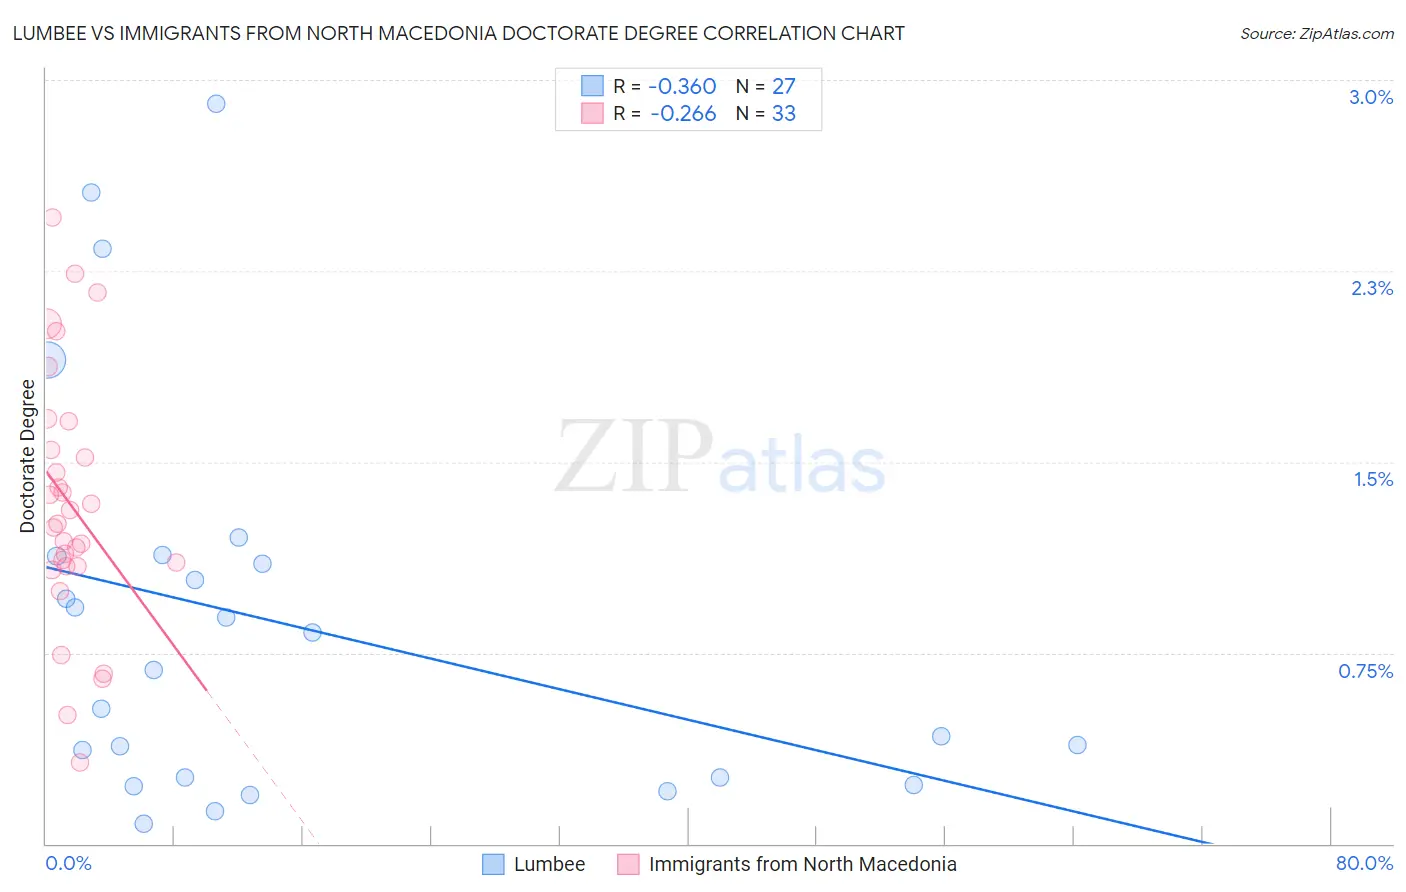
Lumbee vs Immigrants from North Macedonia Doctorate Degree Correlation Chart
The statistical analysis conducted on geographies consisting of 91,789,296 people shows a mild negative correlation between the proportion of Lumbee and percentage of population with at least doctorate degree education in the United States with a correlation coefficient (R) of -0.360 and weighted average of 1.1%. Similarly, the statistical analysis conducted on geographies consisting of 73,878,917 people shows a weak negative correlation between the proportion of Immigrants from North Macedonia and percentage of population with at least doctorate degree education in the United States with a correlation coefficient (R) of -0.266 and weighted average of 1.6%, a difference of 49.0%.
Doctorate Degree Correlation Summary
| Measurement | Lumbee | Immigrants from North Macedonia |
| Minimum | 0.076% | 0.32% |
| Maximum | 2.9% | 2.5% |
| Range | 2.8% | 2.1% |
| Mean | 0.86% | 1.3% |
| Median | 0.68% | 1.3% |
| Interquartile 25% (IQ1) | 0.26% | 1.1% |
| Interquartile 75% (IQ3) | 1.1% | 1.6% |
| Interquartile Range (IQR) | 0.87% | 0.51% |
| Standard Deviation (Sample) | 0.77% | 0.50% |
| Standard Deviation (Population) | 0.75% | 0.49% |
Similar Demographics by Doctorate Degree
Demographics Similar to Lumbee by Doctorate Degree
In terms of doctorate degree, the demographic groups most similar to Lumbee are Immigrants from Mexico (1.1%, a difference of 1.5%), Spanish American Indian (1.1%, a difference of 2.8%), Fijian (1.1%, a difference of 3.6%), Arapaho (1.2%, a difference of 7.1%), and Mexican (1.2%, a difference of 7.5%).
| Demographics | Rating | Rank | Doctorate Degree |
| Immigrants | Caribbean | 0.0 /100 | #333 | Tragic 1.3% |
| Immigrants | Dominican Republic | 0.0 /100 | #334 | Tragic 1.3% |
| Immigrants | Haiti | 0.0 /100 | #335 | Tragic 1.3% |
| Nepalese | 0.0 /100 | #336 | Tragic 1.3% |
| Bangladeshis | 0.0 /100 | #337 | Tragic 1.2% |
| Puget Sound Salish | 0.0 /100 | #338 | Tragic 1.2% |
| Immigrants | Central America | 0.0 /100 | #339 | Tragic 1.2% |
| Immigrants | Cuba | 0.0 /100 | #340 | Tragic 1.2% |
| Mexicans | 0.0 /100 | #341 | Tragic 1.2% |
| Arapaho | 0.0 /100 | #342 | Tragic 1.2% |
| Fijians | 0.0 /100 | #343 | Tragic 1.1% |
| Immigrants | Mexico | 0.0 /100 | #344 | Tragic 1.1% |
| Lumbee | 0.0 /100 | #345 | Tragic 1.1% |
| Spanish American Indians | 0.0 /100 | #346 | Tragic 1.1% |
| Houma | 0.0 /100 | #347 | Tragic 0.96% |
Demographics Similar to Immigrants from North Macedonia by Doctorate Degree
In terms of doctorate degree, the demographic groups most similar to Immigrants from North Macedonia are Immigrants from Philippines (1.6%, a difference of 0.47%), Guamanian/Chamorro (1.6%, a difference of 0.69%), Barbadian (1.6%, a difference of 0.76%), Colville (1.6%, a difference of 0.78%), and Hopi (1.6%, a difference of 0.90%).
| Demographics | Rating | Rank | Doctorate Degree |
| Immigrants | Poland | 7.4 /100 | #224 | Tragic 1.7% |
| Immigrants | Colombia | 6.7 /100 | #225 | Tragic 1.7% |
| Osage | 6.5 /100 | #226 | Tragic 1.7% |
| Panamanians | 6.3 /100 | #227 | Tragic 1.7% |
| Assyrians/Chaldeans/Syriacs | 5.9 /100 | #228 | Tragic 1.7% |
| Colville | 4.7 /100 | #229 | Tragic 1.6% |
| Immigrants | Philippines | 4.3 /100 | #230 | Tragic 1.6% |
| Immigrants | North Macedonia | 3.9 /100 | #231 | Tragic 1.6% |
| Guamanians/Chamorros | 3.3 /100 | #232 | Tragic 1.6% |
| Barbadians | 3.3 /100 | #233 | Tragic 1.6% |
| Hopi | 3.2 /100 | #234 | Tragic 1.6% |
| Cree | 3.0 /100 | #235 | Tragic 1.6% |
| Indonesians | 2.8 /100 | #236 | Tragic 1.6% |
| Iroquois | 2.7 /100 | #237 | Tragic 1.6% |
| Immigrants | Congo | 2.6 /100 | #238 | Tragic 1.6% |