Ute vs Uruguayan Doctorate Degree
COMPARE
Ute
Uruguayan
Doctorate Degree
Doctorate Degree Comparison
Ute
Uruguayans
2.0%
DOCTORATE DEGREE
93.2/ 100
METRIC RATING
124th/ 347
METRIC RANK
1.8%
DOCTORATE DEGREE
26.2/ 100
METRIC RATING
194th/ 347
METRIC RANK
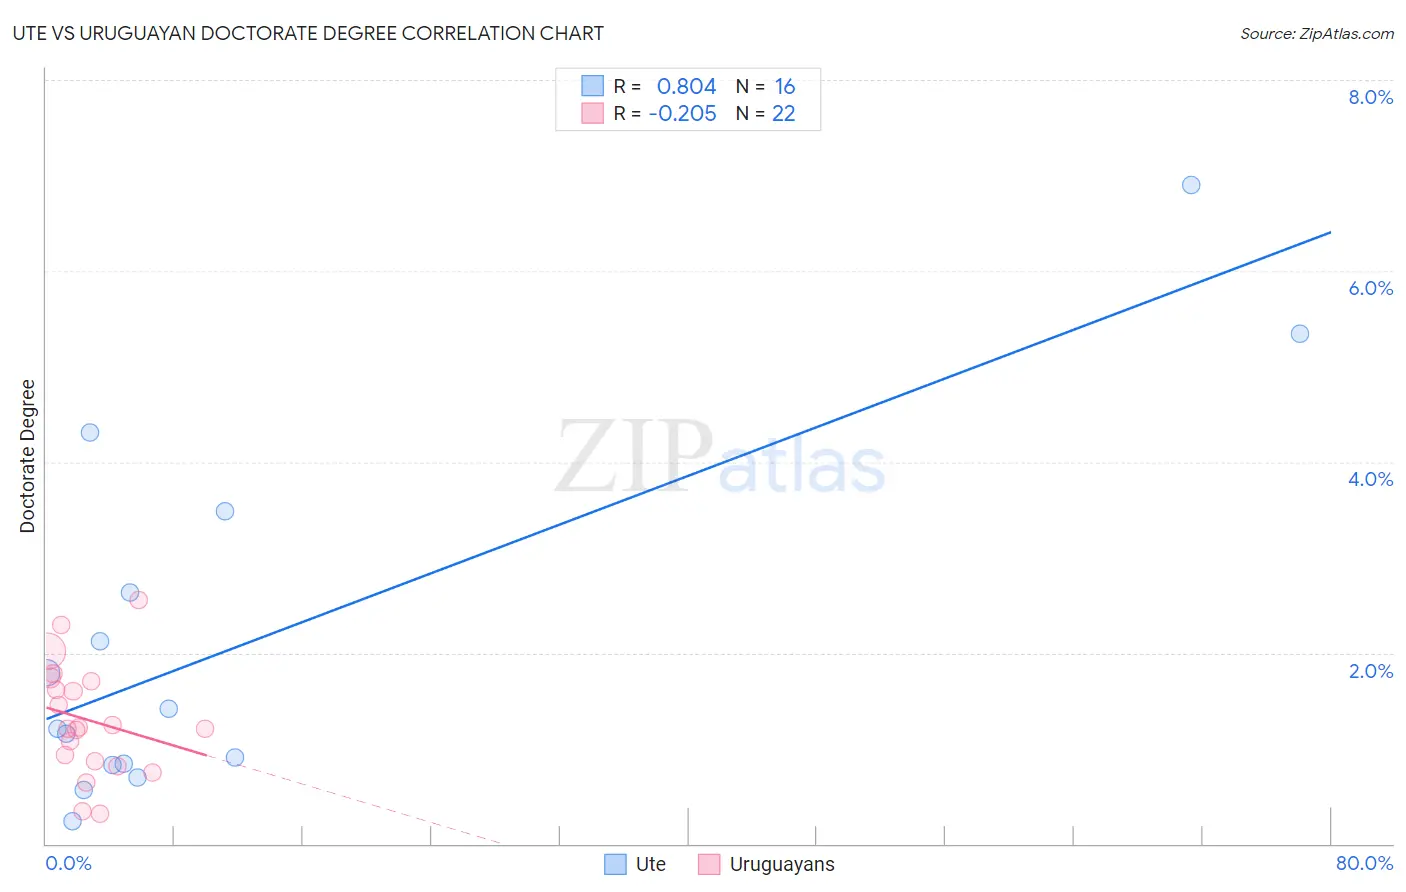
Ute vs Uruguayan Doctorate Degree Correlation Chart
The statistical analysis conducted on geographies consisting of 55,479,547 people shows a very strong positive correlation between the proportion of Ute and percentage of population with at least doctorate degree education in the United States with a correlation coefficient (R) of 0.804 and weighted average of 2.0%. Similarly, the statistical analysis conducted on geographies consisting of 144,575,670 people shows a weak negative correlation between the proportion of Uruguayans and percentage of population with at least doctorate degree education in the United States with a correlation coefficient (R) of -0.205 and weighted average of 1.8%, a difference of 13.9%.
Doctorate Degree Correlation Summary
| Measurement | Ute | Uruguayan |
| Minimum | 0.23% | 0.31% |
| Maximum | 6.9% | 2.6% |
| Range | 6.7% | 2.2% |
| Mean | 2.1% | 1.3% |
| Median | 1.3% | 1.2% |
| Interquartile 25% (IQ1) | 0.83% | 0.86% |
| Interquartile 75% (IQ3) | 3.1% | 1.7% |
| Interquartile Range (IQR) | 2.2% | 0.84% |
| Standard Deviation (Sample) | 1.9% | 0.58% |
| Standard Deviation (Population) | 1.9% | 0.57% |
Similar Demographics by Doctorate Degree
Demographics Similar to Ute by Doctorate Degree
In terms of doctorate degree, the demographic groups most similar to Ute are Moroccan (2.0%, a difference of 0.11%), Croatian (2.0%, a difference of 0.47%), Jordanian (2.0%, a difference of 0.52%), Palestinian (2.0%, a difference of 0.56%), and Immigrants from Southern Europe (2.0%, a difference of 0.93%).
| Demographics | Rating | Rank | Doctorate Degree |
| Lebanese | 96.0 /100 | #117 | Exceptional 2.1% |
| Icelanders | 96.0 /100 | #118 | Exceptional 2.1% |
| Pakistanis | 95.8 /100 | #119 | Exceptional 2.0% |
| Immigrants | Morocco | 95.5 /100 | #120 | Exceptional 2.0% |
| Immigrants | Jordan | 94.8 /100 | #121 | Exceptional 2.0% |
| Immigrants | Southern Europe | 94.7 /100 | #122 | Exceptional 2.0% |
| Croatians | 94.0 /100 | #123 | Exceptional 2.0% |
| Ute | 93.2 /100 | #124 | Exceptional 2.0% |
| Moroccans | 93.0 /100 | #125 | Exceptional 2.0% |
| Jordanians | 92.1 /100 | #126 | Exceptional 2.0% |
| Palestinians | 92.0 /100 | #127 | Exceptional 2.0% |
| Immigrants | Zaire | 91.1 /100 | #128 | Exceptional 2.0% |
| Canadians | 90.6 /100 | #129 | Exceptional 2.0% |
| Immigrants | Ukraine | 90.5 /100 | #130 | Exceptional 2.0% |
| Immigrants | Sierra Leone | 90.2 /100 | #131 | Exceptional 2.0% |
Demographics Similar to Uruguayans by Doctorate Degree
In terms of doctorate degree, the demographic groups most similar to Uruguayans are Immigrants from Somalia (1.8%, a difference of 0.15%), German Russian (1.8%, a difference of 0.17%), Subsaharan African (1.8%, a difference of 0.22%), Chinese (1.8%, a difference of 0.23%), and Dutch (1.8%, a difference of 0.24%).
| Demographics | Rating | Rank | Doctorate Degree |
| Czechoslovakians | 33.0 /100 | #187 | Fair 1.8% |
| Germans | 30.5 /100 | #188 | Fair 1.8% |
| French Canadians | 30.2 /100 | #189 | Fair 1.8% |
| Immigrants | Costa Rica | 30.2 /100 | #190 | Fair 1.8% |
| South Americans | 29.5 /100 | #191 | Fair 1.8% |
| Dutch | 27.4 /100 | #192 | Fair 1.8% |
| German Russians | 27.1 /100 | #193 | Fair 1.8% |
| Uruguayans | 26.2 /100 | #194 | Fair 1.8% |
| Immigrants | Somalia | 25.4 /100 | #195 | Fair 1.8% |
| Sub-Saharan Africans | 25.1 /100 | #196 | Fair 1.8% |
| Chinese | 25.1 /100 | #197 | Fair 1.8% |
| Immigrants | Ghana | 24.6 /100 | #198 | Fair 1.8% |
| Immigrants | South America | 23.3 /100 | #199 | Fair 1.8% |
| Whites/Caucasians | 22.8 /100 | #200 | Fair 1.8% |
| Immigrants | Nigeria | 22.4 /100 | #201 | Fair 1.8% |