Lumbee vs Immigrants from Fiji Associate's Degree
COMPARE
Lumbee
Immigrants from Fiji
Associate's Degree
Associate's Degree Comparison
Lumbee
Immigrants from Fiji
34.1%
ASSOCIATE'S DEGREE
0.0/ 100
METRIC RATING
337th/ 347
METRIC RANK
42.2%
ASSOCIATE'S DEGREE
0.8/ 100
METRIC RATING
247th/ 347
METRIC RANK
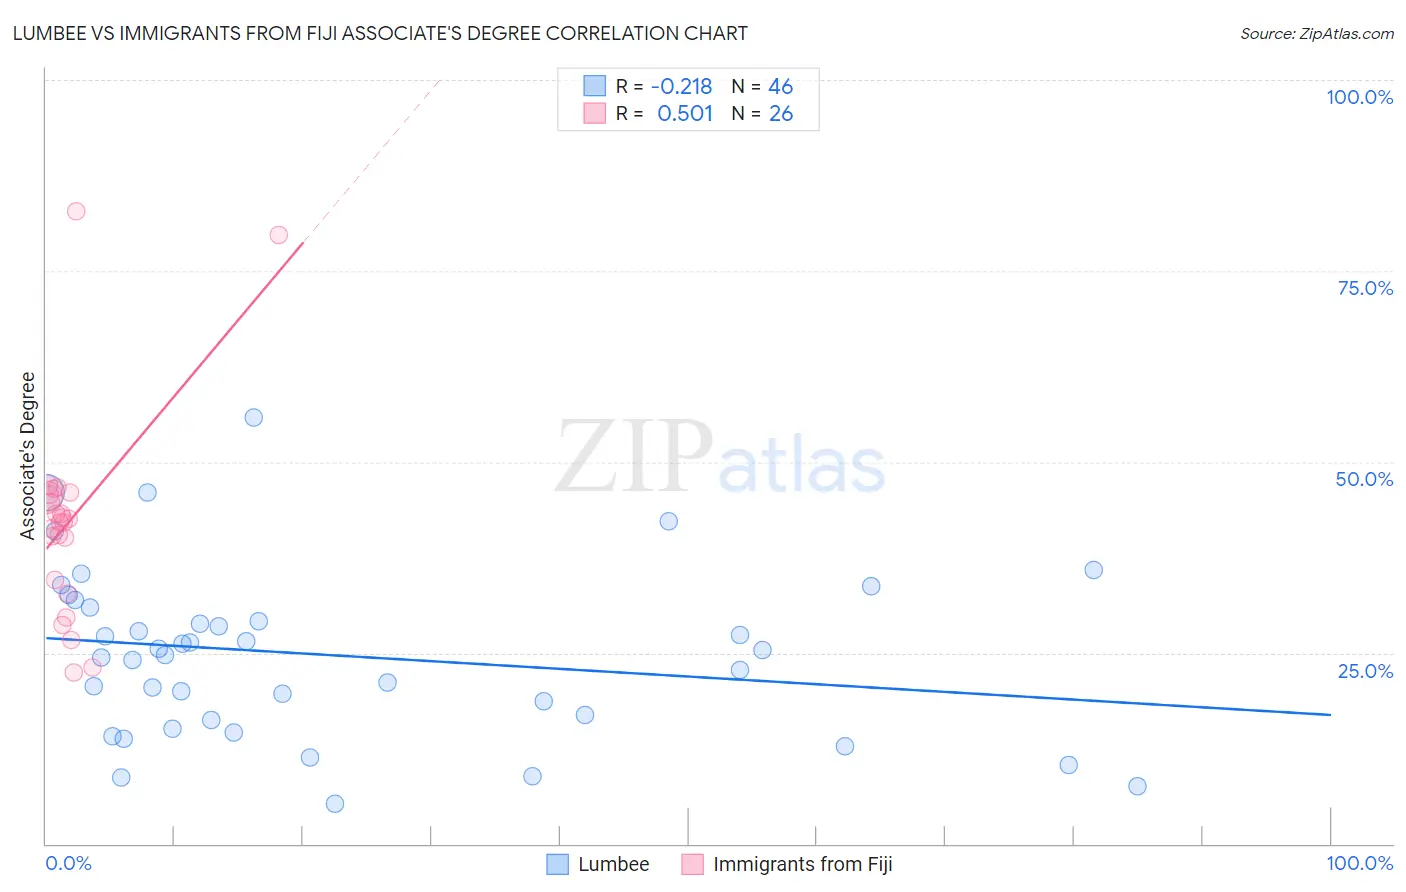
Lumbee vs Immigrants from Fiji Associate's Degree Correlation Chart
The statistical analysis conducted on geographies consisting of 92,299,068 people shows a weak negative correlation between the proportion of Lumbee and percentage of population with at least associate's degree education in the United States with a correlation coefficient (R) of -0.218 and weighted average of 34.1%. Similarly, the statistical analysis conducted on geographies consisting of 93,756,204 people shows a substantial positive correlation between the proportion of Immigrants from Fiji and percentage of population with at least associate's degree education in the United States with a correlation coefficient (R) of 0.501 and weighted average of 42.2%, a difference of 23.7%.
Associate's Degree Correlation Summary
| Measurement | Lumbee | Immigrants from Fiji |
| Minimum | 5.2% | 22.5% |
| Maximum | 55.8% | 82.8% |
| Range | 50.6% | 60.3% |
| Mean | 24.7% | 42.3% |
| Median | 25.1% | 42.3% |
| Interquartile 25% (IQ1) | 16.2% | 34.6% |
| Interquartile 75% (IQ3) | 30.9% | 45.7% |
| Interquartile Range (IQR) | 14.7% | 11.1% |
| Standard Deviation (Sample) | 11.1% | 13.7% |
| Standard Deviation (Population) | 10.9% | 13.4% |
Similar Demographics by Associate's Degree
Demographics Similar to Lumbee by Associate's Degree
In terms of associate's degree, the demographic groups most similar to Lumbee are Pueblo (34.0%, a difference of 0.41%), Immigrants from Mexico (33.7%, a difference of 1.1%), Hopi (34.6%, a difference of 1.3%), Spanish American Indian (34.9%, a difference of 2.2%), and Native/Alaskan (34.9%, a difference of 2.3%).
| Demographics | Rating | Rank | Associate's Degree |
| Apache | 0.0 /100 | #330 | Tragic 36.2% |
| Immigrants | Azores | 0.0 /100 | #331 | Tragic 35.6% |
| Immigrants | Central America | 0.0 /100 | #332 | Tragic 35.0% |
| Mexicans | 0.0 /100 | #333 | Tragic 35.0% |
| Natives/Alaskans | 0.0 /100 | #334 | Tragic 34.9% |
| Spanish American Indians | 0.0 /100 | #335 | Tragic 34.9% |
| Hopi | 0.0 /100 | #336 | Tragic 34.6% |
| Lumbee | 0.0 /100 | #337 | Tragic 34.1% |
| Pueblo | 0.0 /100 | #338 | Tragic 34.0% |
| Immigrants | Mexico | 0.0 /100 | #339 | Tragic 33.7% |
| Navajo | 0.0 /100 | #340 | Tragic 32.6% |
| Inupiat | 0.0 /100 | #341 | Tragic 32.6% |
| Yakama | 0.0 /100 | #342 | Tragic 32.3% |
| Tohono O'odham | 0.0 /100 | #343 | Tragic 31.8% |
| Yuman | 0.0 /100 | #344 | Tragic 31.3% |
Demographics Similar to Immigrants from Fiji by Associate's Degree
In terms of associate's degree, the demographic groups most similar to Immigrants from Fiji are Delaware (42.3%, a difference of 0.090%), Immigrants from Ecuador (42.2%, a difference of 0.090%), Immigrants from Cambodia (42.3%, a difference of 0.12%), Immigrants from Liberia (42.3%, a difference of 0.14%), and Jamaican (42.1%, a difference of 0.23%).
| Demographics | Rating | Rank | Associate's Degree |
| Cree | 1.2 /100 | #240 | Tragic 42.5% |
| British West Indians | 1.0 /100 | #241 | Tragic 42.4% |
| Immigrants | West Indies | 1.0 /100 | #242 | Tragic 42.4% |
| Guyanese | 1.0 /100 | #243 | Tragic 42.3% |
| Immigrants | Liberia | 0.9 /100 | #244 | Tragic 42.3% |
| Immigrants | Cambodia | 0.9 /100 | #245 | Tragic 42.3% |
| Delaware | 0.9 /100 | #246 | Tragic 42.3% |
| Immigrants | Fiji | 0.8 /100 | #247 | Tragic 42.2% |
| Immigrants | Ecuador | 0.8 /100 | #248 | Tragic 42.2% |
| Jamaicans | 0.7 /100 | #249 | Tragic 42.1% |
| U.S. Virgin Islanders | 0.7 /100 | #250 | Tragic 42.1% |
| Immigrants | Bahamas | 0.7 /100 | #251 | Tragic 42.1% |
| French American Indians | 0.6 /100 | #252 | Tragic 42.0% |
| Indonesians | 0.6 /100 | #253 | Tragic 41.9% |
| Cubans | 0.6 /100 | #254 | Tragic 41.9% |