Lumbee vs Venezuelan Associate's Degree
COMPARE
Lumbee
Venezuelan
Associate's Degree
Associate's Degree Comparison
Lumbee
Venezuelans
34.1%
ASSOCIATE'S DEGREE
0.0/ 100
METRIC RATING
337th/ 347
METRIC RANK
49.4%
ASSOCIATE'S DEGREE
97.0/ 100
METRIC RATING
104th/ 347
METRIC RANK
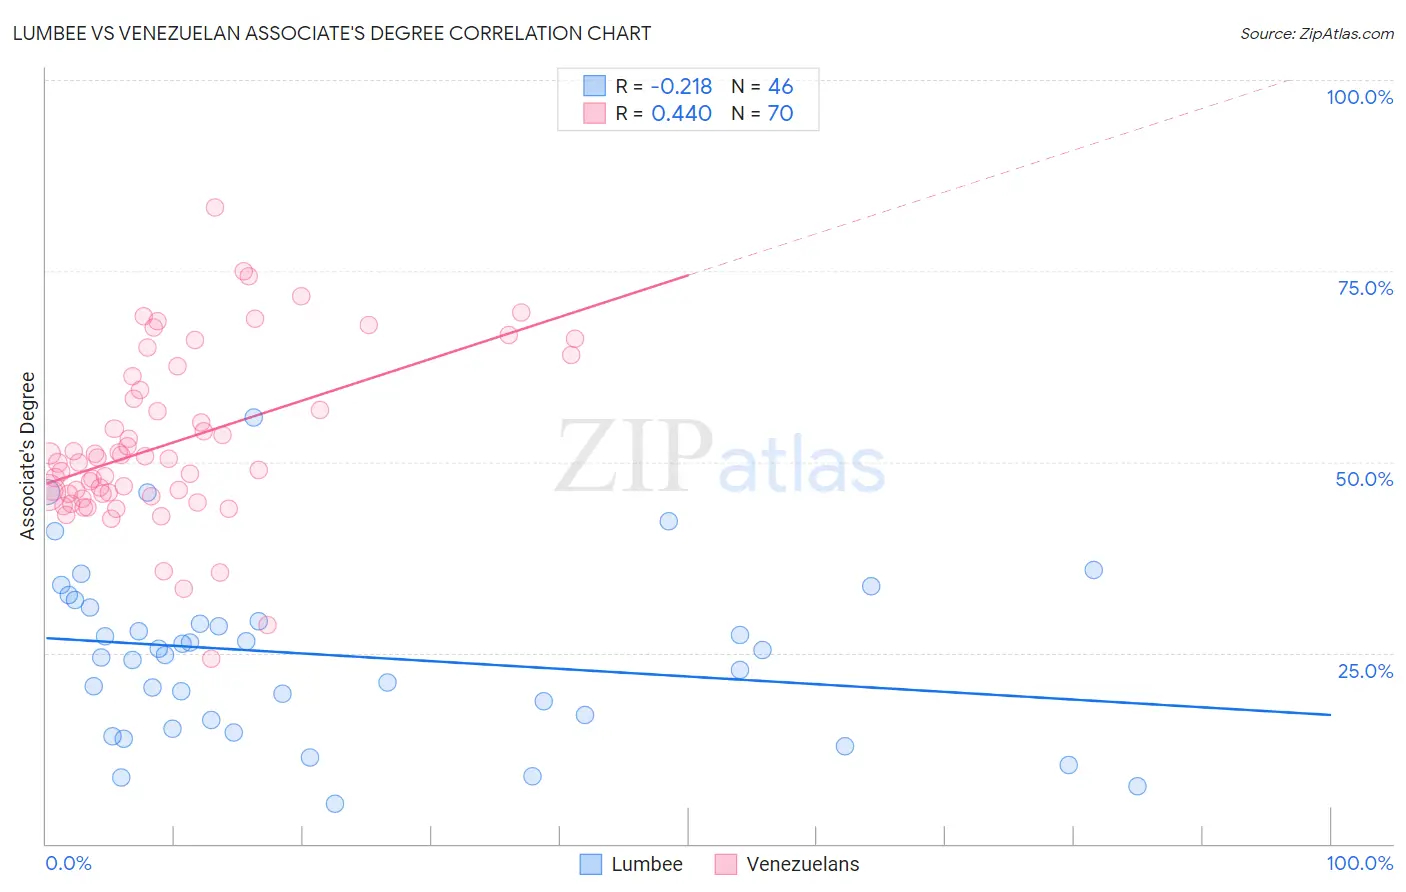
Lumbee vs Venezuelan Associate's Degree Correlation Chart
The statistical analysis conducted on geographies consisting of 92,299,068 people shows a weak negative correlation between the proportion of Lumbee and percentage of population with at least associate's degree education in the United States with a correlation coefficient (R) of -0.218 and weighted average of 34.1%. Similarly, the statistical analysis conducted on geographies consisting of 306,307,372 people shows a moderate positive correlation between the proportion of Venezuelans and percentage of population with at least associate's degree education in the United States with a correlation coefficient (R) of 0.440 and weighted average of 49.4%, a difference of 44.7%.
Associate's Degree Correlation Summary
| Measurement | Lumbee | Venezuelan |
| Minimum | 5.2% | 24.3% |
| Maximum | 55.8% | 83.4% |
| Range | 50.6% | 59.1% |
| Mean | 24.7% | 52.4% |
| Median | 25.1% | 50.1% |
| Interquartile 25% (IQ1) | 16.2% | 45.8% |
| Interquartile 75% (IQ3) | 30.9% | 59.4% |
| Interquartile Range (IQR) | 14.7% | 13.7% |
| Standard Deviation (Sample) | 11.1% | 11.2% |
| Standard Deviation (Population) | 10.9% | 11.1% |
Similar Demographics by Associate's Degree
Demographics Similar to Lumbee by Associate's Degree
In terms of associate's degree, the demographic groups most similar to Lumbee are Pueblo (34.0%, a difference of 0.41%), Immigrants from Mexico (33.7%, a difference of 1.1%), Hopi (34.6%, a difference of 1.3%), Spanish American Indian (34.9%, a difference of 2.2%), and Native/Alaskan (34.9%, a difference of 2.3%).
| Demographics | Rating | Rank | Associate's Degree |
| Apache | 0.0 /100 | #330 | Tragic 36.2% |
| Immigrants | Azores | 0.0 /100 | #331 | Tragic 35.6% |
| Immigrants | Central America | 0.0 /100 | #332 | Tragic 35.0% |
| Mexicans | 0.0 /100 | #333 | Tragic 35.0% |
| Natives/Alaskans | 0.0 /100 | #334 | Tragic 34.9% |
| Spanish American Indians | 0.0 /100 | #335 | Tragic 34.9% |
| Hopi | 0.0 /100 | #336 | Tragic 34.6% |
| Lumbee | 0.0 /100 | #337 | Tragic 34.1% |
| Pueblo | 0.0 /100 | #338 | Tragic 34.0% |
| Immigrants | Mexico | 0.0 /100 | #339 | Tragic 33.7% |
| Navajo | 0.0 /100 | #340 | Tragic 32.6% |
| Inupiat | 0.0 /100 | #341 | Tragic 32.6% |
| Yakama | 0.0 /100 | #342 | Tragic 32.3% |
| Tohono O'odham | 0.0 /100 | #343 | Tragic 31.8% |
| Yuman | 0.0 /100 | #344 | Tragic 31.3% |
Demographics Similar to Venezuelans by Associate's Degree
In terms of associate's degree, the demographic groups most similar to Venezuelans are Ukrainian (49.4%, a difference of 0.060%), Croatian (49.3%, a difference of 0.15%), Immigrants from Italy (49.3%, a difference of 0.15%), Chilean (49.4%, a difference of 0.17%), and Syrian (49.3%, a difference of 0.18%).
| Demographics | Rating | Rank | Associate's Degree |
| Immigrants | Ukraine | 98.0 /100 | #97 | Exceptional 49.7% |
| Immigrants | Northern Africa | 97.9 /100 | #98 | Exceptional 49.7% |
| Macedonians | 97.8 /100 | #99 | Exceptional 49.6% |
| Immigrants | Nepal | 97.5 /100 | #100 | Exceptional 49.5% |
| Northern Europeans | 97.3 /100 | #101 | Exceptional 49.5% |
| Chileans | 97.3 /100 | #102 | Exceptional 49.4% |
| Ukrainians | 97.1 /100 | #103 | Exceptional 49.4% |
| Venezuelans | 97.0 /100 | #104 | Exceptional 49.4% |
| Croatians | 96.8 /100 | #105 | Exceptional 49.3% |
| Immigrants | Italy | 96.7 /100 | #106 | Exceptional 49.3% |
| Syrians | 96.7 /100 | #107 | Exceptional 49.3% |
| Jordanians | 96.6 /100 | #108 | Exceptional 49.2% |
| Immigrants | Morocco | 96.3 /100 | #109 | Exceptional 49.2% |
| Austrians | 95.8 /100 | #110 | Exceptional 49.1% |
| Immigrants | Venezuela | 95.8 /100 | #111 | Exceptional 49.1% |