Lumbee vs Immigrants from Fiji Ambulatory Disability
COMPARE
Lumbee
Immigrants from Fiji
Ambulatory Disability
Ambulatory Disability Comparison
Lumbee
Immigrants from Fiji
9.5%
AMBULATORY DISABILITY
0.0/ 100
METRIC RATING
347th/ 347
METRIC RANK
6.0%
AMBULATORY DISABILITY
71.2/ 100
METRIC RATING
158th/ 347
METRIC RANK
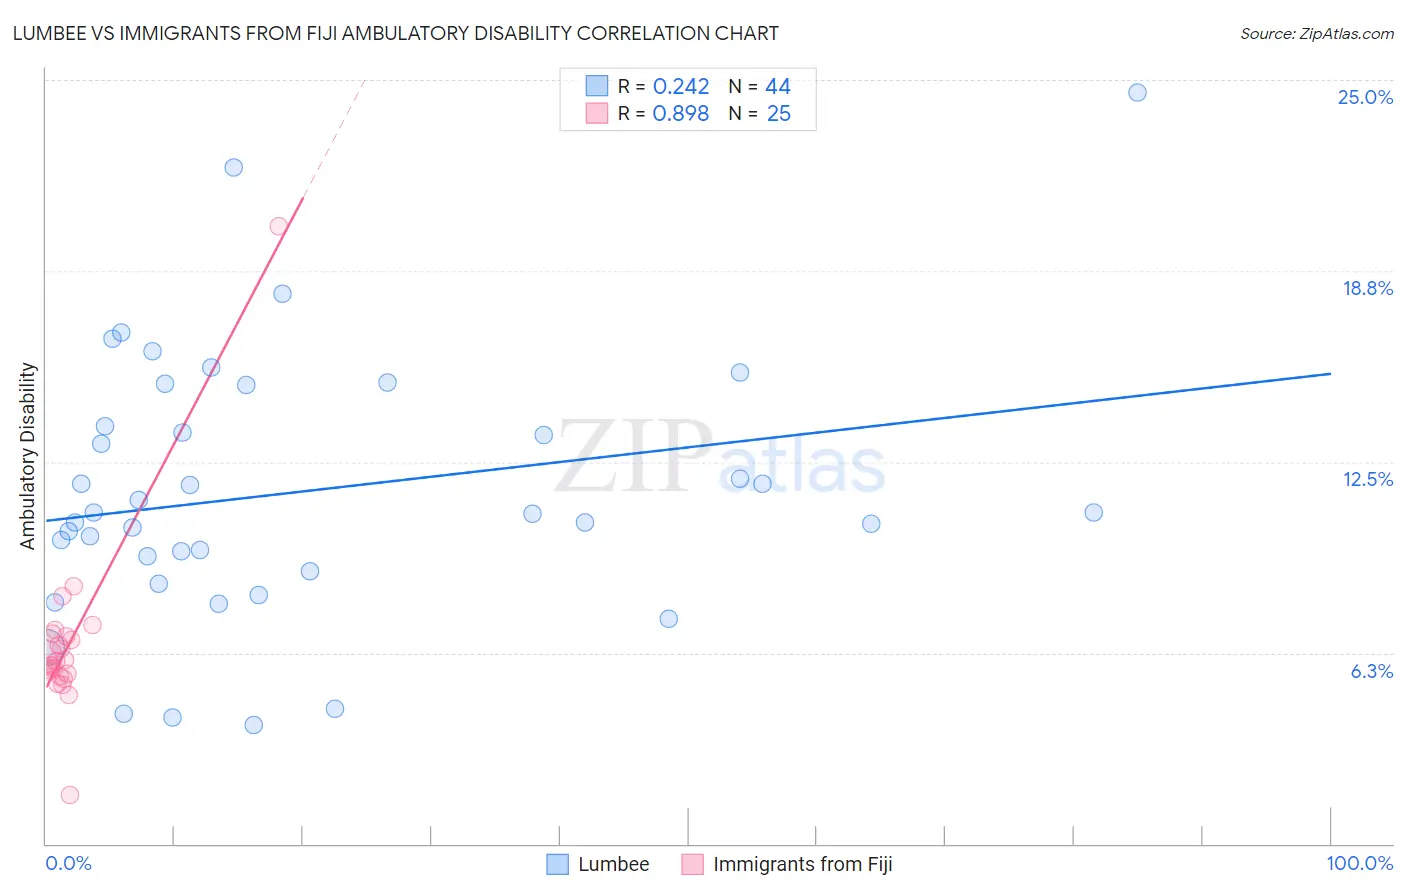
Lumbee vs Immigrants from Fiji Ambulatory Disability Correlation Chart
The statistical analysis conducted on geographies consisting of 92,273,744 people shows a weak positive correlation between the proportion of Lumbee and percentage of population with ambulatory disability in the United States with a correlation coefficient (R) of 0.242 and weighted average of 9.5%. Similarly, the statistical analysis conducted on geographies consisting of 93,755,380 people shows a very strong positive correlation between the proportion of Immigrants from Fiji and percentage of population with ambulatory disability in the United States with a correlation coefficient (R) of 0.898 and weighted average of 6.0%, a difference of 57.8%.
Ambulatory Disability Correlation Summary
| Measurement | Lumbee | Immigrants from Fiji |
| Minimum | 3.9% | 1.6% |
| Maximum | 24.6% | 20.2% |
| Range | 20.7% | 18.6% |
| Mean | 11.5% | 6.6% |
| Median | 10.8% | 6.0% |
| Interquartile 25% (IQ1) | 9.2% | 5.5% |
| Interquartile 75% (IQ3) | 14.3% | 6.8% |
| Interquartile Range (IQR) | 5.2% | 1.3% |
| Standard Deviation (Sample) | 4.4% | 3.1% |
| Standard Deviation (Population) | 4.3% | 3.0% |
Similar Demographics by Ambulatory Disability
Demographics Similar to Lumbee by Ambulatory Disability
In terms of ambulatory disability, the demographic groups most similar to Lumbee are Houma (9.3%, a difference of 2.5%), Puerto Rican (8.9%, a difference of 7.5%), Tsimshian (8.8%, a difference of 8.2%), Tohono O'odham (8.7%, a difference of 9.2%), and Kiowa (8.6%, a difference of 10.8%).
| Demographics | Rating | Rank | Ambulatory Disability |
| Cherokee | 0.0 /100 | #333 | Tragic 7.9% |
| Yuman | 0.0 /100 | #334 | Tragic 7.9% |
| Chickasaw | 0.0 /100 | #335 | Tragic 8.0% |
| Seminole | 0.0 /100 | #336 | Tragic 8.0% |
| Dutch West Indians | 0.0 /100 | #337 | Tragic 8.2% |
| Colville | 0.0 /100 | #338 | Tragic 8.2% |
| Pima | 0.0 /100 | #339 | Tragic 8.2% |
| Choctaw | 0.0 /100 | #340 | Tragic 8.3% |
| Creek | 0.0 /100 | #341 | Tragic 8.5% |
| Kiowa | 0.0 /100 | #342 | Tragic 8.6% |
| Tohono O'odham | 0.0 /100 | #343 | Tragic 8.7% |
| Tsimshian | 0.0 /100 | #344 | Tragic 8.8% |
| Puerto Ricans | 0.0 /100 | #345 | Tragic 8.9% |
| Houma | 0.0 /100 | #346 | Tragic 9.3% |
| Lumbee | 0.0 /100 | #347 | Tragic 9.5% |
Demographics Similar to Immigrants from Fiji by Ambulatory Disability
In terms of ambulatory disability, the demographic groups most similar to Immigrants from Fiji are Ghanaian (6.0%, a difference of 0.010%), Immigrants from Latvia (6.0%, a difference of 0.010%), Northern European (6.0%, a difference of 0.050%), Immigrants from Scotland (6.0%, a difference of 0.070%), and Central American (6.0%, a difference of 0.080%).
| Demographics | Rating | Rank | Ambulatory Disability |
| Greeks | 79.6 /100 | #151 | Good 6.0% |
| Immigrants | Austria | 78.8 /100 | #152 | Good 6.0% |
| Syrians | 75.5 /100 | #153 | Good 6.0% |
| Immigrants | Croatia | 75.1 /100 | #154 | Good 6.0% |
| Immigrants | Scotland | 72.1 /100 | #155 | Good 6.0% |
| Northern Europeans | 71.8 /100 | #156 | Good 6.0% |
| Ghanaians | 71.3 /100 | #157 | Good 6.0% |
| Immigrants | Fiji | 71.2 /100 | #158 | Good 6.0% |
| Immigrants | Latvia | 71.1 /100 | #159 | Good 6.0% |
| Central Americans | 69.8 /100 | #160 | Good 6.0% |
| Immigrants | Belarus | 69.2 /100 | #161 | Good 6.1% |
| Nigerians | 67.1 /100 | #162 | Good 6.1% |
| Lebanese | 66.2 /100 | #163 | Good 6.1% |
| Basques | 63.7 /100 | #164 | Good 6.1% |
| Nicaraguans | 63.2 /100 | #165 | Good 6.1% |