Lumbee vs Iraqi Associate's Degree
COMPARE
Lumbee
Iraqi
Associate's Degree
Associate's Degree Comparison
Lumbee
Iraqis
34.1%
ASSOCIATE'S DEGREE
0.0/ 100
METRIC RATING
337th/ 347
METRIC RANK
47.4%
ASSOCIATE'S DEGREE
76.2/ 100
METRIC RATING
150th/ 347
METRIC RANK
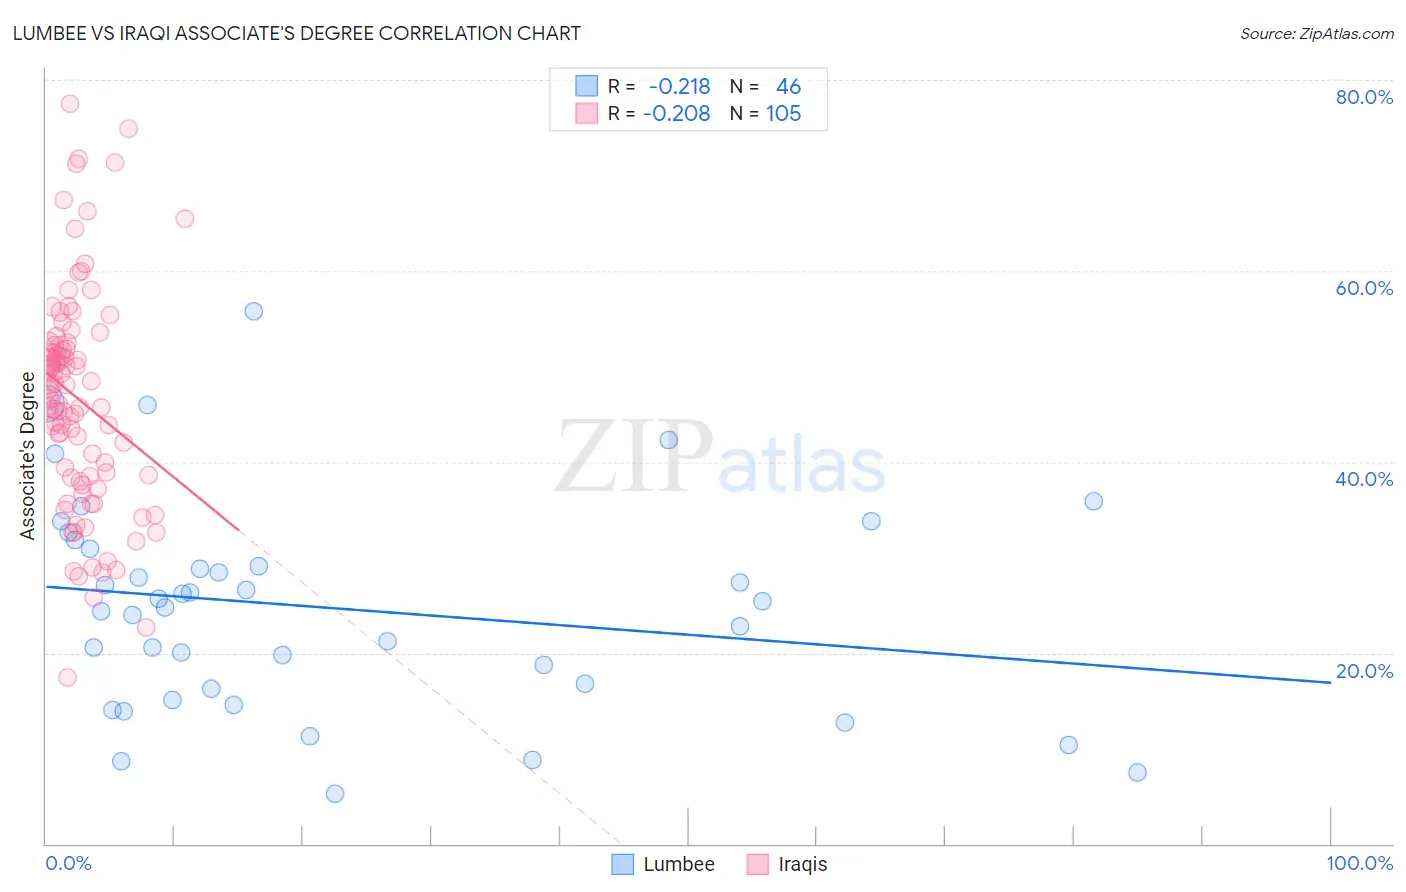
Lumbee vs Iraqi Associate's Degree Correlation Chart
The statistical analysis conducted on geographies consisting of 92,299,068 people shows a weak negative correlation between the proportion of Lumbee and percentage of population with at least associate's degree education in the United States with a correlation coefficient (R) of -0.218 and weighted average of 34.1%. Similarly, the statistical analysis conducted on geographies consisting of 170,654,197 people shows a weak negative correlation between the proportion of Iraqis and percentage of population with at least associate's degree education in the United States with a correlation coefficient (R) of -0.208 and weighted average of 47.4%, a difference of 38.8%.
Associate's Degree Correlation Summary
| Measurement | Lumbee | Iraqi |
| Minimum | 5.2% | 17.5% |
| Maximum | 55.8% | 77.6% |
| Range | 50.6% | 60.1% |
| Mean | 24.7% | 46.6% |
| Median | 25.1% | 48.1% |
| Interquartile 25% (IQ1) | 16.2% | 38.4% |
| Interquartile 75% (IQ3) | 30.9% | 52.3% |
| Interquartile Range (IQR) | 14.7% | 13.8% |
| Standard Deviation (Sample) | 11.1% | 11.5% |
| Standard Deviation (Population) | 10.9% | 11.4% |
Similar Demographics by Associate's Degree
Demographics Similar to Lumbee by Associate's Degree
In terms of associate's degree, the demographic groups most similar to Lumbee are Pueblo (34.0%, a difference of 0.41%), Immigrants from Mexico (33.7%, a difference of 1.1%), Hopi (34.6%, a difference of 1.3%), Spanish American Indian (34.9%, a difference of 2.2%), and Native/Alaskan (34.9%, a difference of 2.3%).
| Demographics | Rating | Rank | Associate's Degree |
| Apache | 0.0 /100 | #330 | Tragic 36.2% |
| Immigrants | Azores | 0.0 /100 | #331 | Tragic 35.6% |
| Immigrants | Central America | 0.0 /100 | #332 | Tragic 35.0% |
| Mexicans | 0.0 /100 | #333 | Tragic 35.0% |
| Natives/Alaskans | 0.0 /100 | #334 | Tragic 34.9% |
| Spanish American Indians | 0.0 /100 | #335 | Tragic 34.9% |
| Hopi | 0.0 /100 | #336 | Tragic 34.6% |
| Lumbee | 0.0 /100 | #337 | Tragic 34.1% |
| Pueblo | 0.0 /100 | #338 | Tragic 34.0% |
| Immigrants | Mexico | 0.0 /100 | #339 | Tragic 33.7% |
| Navajo | 0.0 /100 | #340 | Tragic 32.6% |
| Inupiat | 0.0 /100 | #341 | Tragic 32.6% |
| Yakama | 0.0 /100 | #342 | Tragic 32.3% |
| Tohono O'odham | 0.0 /100 | #343 | Tragic 31.8% |
| Yuman | 0.0 /100 | #344 | Tragic 31.3% |
Demographics Similar to Iraqis by Associate's Degree
In terms of associate's degree, the demographic groups most similar to Iraqis are Immigrants from North Macedonia (47.4%, a difference of 0.020%), Immigrants from Armenia (47.4%, a difference of 0.040%), South American Indian (47.4%, a difference of 0.050%), Danish (47.4%, a difference of 0.11%), and Immigrants from Sudan (47.4%, a difference of 0.17%).
| Demographics | Rating | Rank | Associate's Degree |
| Norwegians | 81.0 /100 | #143 | Excellent 47.6% |
| Slavs | 80.5 /100 | #144 | Excellent 47.6% |
| Canadians | 79.0 /100 | #145 | Good 47.5% |
| Immigrants | Sudan | 77.9 /100 | #146 | Good 47.4% |
| Danes | 77.3 /100 | #147 | Good 47.4% |
| South American Indians | 76.7 /100 | #148 | Good 47.4% |
| Immigrants | Armenia | 76.6 /100 | #149 | Good 47.4% |
| Iraqis | 76.2 /100 | #150 | Good 47.4% |
| Immigrants | North Macedonia | 76.0 /100 | #151 | Good 47.4% |
| Immigrants | Afghanistan | 74.3 /100 | #152 | Good 47.3% |
| Czechs | 72.2 /100 | #153 | Good 47.2% |
| Immigrants | Kenya | 72.1 /100 | #154 | Good 47.2% |
| Kenyans | 70.6 /100 | #155 | Good 47.1% |
| South Americans | 70.5 /100 | #156 | Good 47.1% |
| Sudanese | 70.3 /100 | #157 | Good 47.1% |