Lumbee vs Immigrants from Malaysia Associate's Degree
COMPARE
Lumbee
Immigrants from Malaysia
Associate's Degree
Associate's Degree Comparison
Lumbee
Immigrants from Malaysia
34.1%
ASSOCIATE'S DEGREE
0.0/ 100
METRIC RATING
337th/ 347
METRIC RANK
52.5%
ASSOCIATE'S DEGREE
99.9/ 100
METRIC RATING
42nd/ 347
METRIC RANK
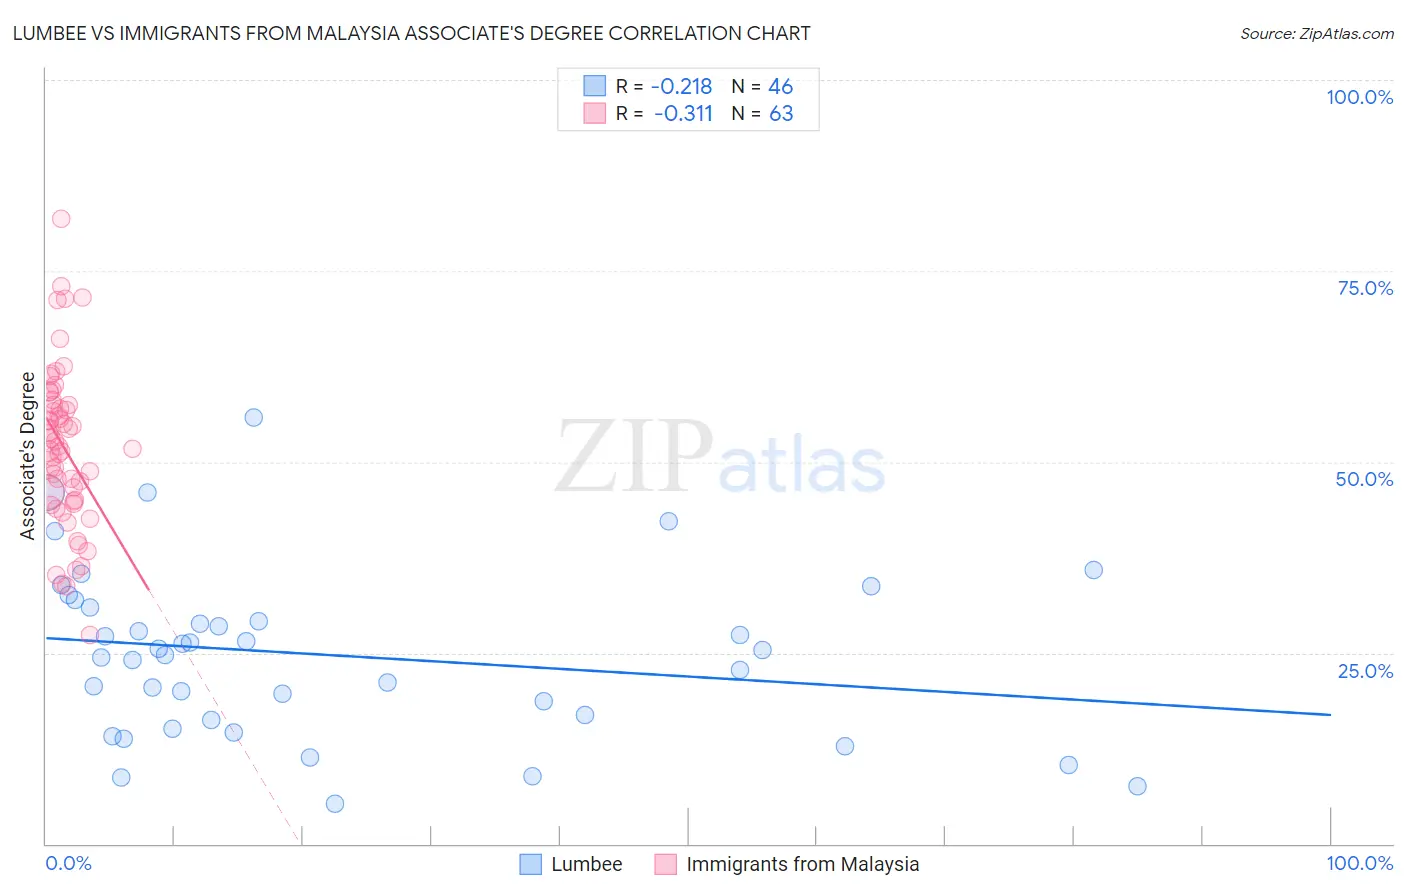
Lumbee vs Immigrants from Malaysia Associate's Degree Correlation Chart
The statistical analysis conducted on geographies consisting of 92,299,068 people shows a weak negative correlation between the proportion of Lumbee and percentage of population with at least associate's degree education in the United States with a correlation coefficient (R) of -0.218 and weighted average of 34.1%. Similarly, the statistical analysis conducted on geographies consisting of 197,964,670 people shows a mild negative correlation between the proportion of Immigrants from Malaysia and percentage of population with at least associate's degree education in the United States with a correlation coefficient (R) of -0.311 and weighted average of 52.5%, a difference of 54.0%.
Associate's Degree Correlation Summary
| Measurement | Lumbee | Immigrants from Malaysia |
| Minimum | 5.2% | 27.3% |
| Maximum | 55.8% | 81.8% |
| Range | 50.6% | 54.5% |
| Mean | 24.7% | 52.0% |
| Median | 25.1% | 52.0% |
| Interquartile 25% (IQ1) | 16.2% | 44.8% |
| Interquartile 75% (IQ3) | 30.9% | 57.5% |
| Interquartile Range (IQR) | 14.7% | 12.6% |
| Standard Deviation (Sample) | 11.1% | 10.5% |
| Standard Deviation (Population) | 10.9% | 10.4% |
Similar Demographics by Associate's Degree
Demographics Similar to Lumbee by Associate's Degree
In terms of associate's degree, the demographic groups most similar to Lumbee are Pueblo (34.0%, a difference of 0.41%), Immigrants from Mexico (33.7%, a difference of 1.1%), Hopi (34.6%, a difference of 1.3%), Spanish American Indian (34.9%, a difference of 2.2%), and Native/Alaskan (34.9%, a difference of 2.3%).
| Demographics | Rating | Rank | Associate's Degree |
| Apache | 0.0 /100 | #330 | Tragic 36.2% |
| Immigrants | Azores | 0.0 /100 | #331 | Tragic 35.6% |
| Immigrants | Central America | 0.0 /100 | #332 | Tragic 35.0% |
| Mexicans | 0.0 /100 | #333 | Tragic 35.0% |
| Natives/Alaskans | 0.0 /100 | #334 | Tragic 34.9% |
| Spanish American Indians | 0.0 /100 | #335 | Tragic 34.9% |
| Hopi | 0.0 /100 | #336 | Tragic 34.6% |
| Lumbee | 0.0 /100 | #337 | Tragic 34.1% |
| Pueblo | 0.0 /100 | #338 | Tragic 34.0% |
| Immigrants | Mexico | 0.0 /100 | #339 | Tragic 33.7% |
| Navajo | 0.0 /100 | #340 | Tragic 32.6% |
| Inupiat | 0.0 /100 | #341 | Tragic 32.6% |
| Yakama | 0.0 /100 | #342 | Tragic 32.3% |
| Tohono O'odham | 0.0 /100 | #343 | Tragic 31.8% |
| Yuman | 0.0 /100 | #344 | Tragic 31.3% |
Demographics Similar to Immigrants from Malaysia by Associate's Degree
In terms of associate's degree, the demographic groups most similar to Immigrants from Malaysia are Immigrants from South Africa (52.5%, a difference of 0.010%), Immigrants from Saudi Arabia (52.6%, a difference of 0.030%), Estonian (52.5%, a difference of 0.10%), Immigrants from Lithuania (52.4%, a difference of 0.17%), and Immigrants from Bulgaria (52.4%, a difference of 0.31%).
| Demographics | Rating | Rank | Associate's Degree |
| Russians | 100.0 /100 | #35 | Exceptional 53.2% |
| Immigrants | Russia | 100.0 /100 | #36 | Exceptional 53.1% |
| Immigrants | Denmark | 100.0 /100 | #37 | Exceptional 53.1% |
| Mongolians | 100.0 /100 | #38 | Exceptional 53.0% |
| Immigrants | Belarus | 99.9 /100 | #39 | Exceptional 52.8% |
| Immigrants | Latvia | 99.9 /100 | #40 | Exceptional 52.8% |
| Immigrants | Saudi Arabia | 99.9 /100 | #41 | Exceptional 52.6% |
| Immigrants | Malaysia | 99.9 /100 | #42 | Exceptional 52.5% |
| Immigrants | South Africa | 99.9 /100 | #43 | Exceptional 52.5% |
| Estonians | 99.9 /100 | #44 | Exceptional 52.5% |
| Immigrants | Lithuania | 99.9 /100 | #45 | Exceptional 52.4% |
| Immigrants | Bulgaria | 99.9 /100 | #46 | Exceptional 52.4% |
| Immigrants | Kuwait | 99.9 /100 | #47 | Exceptional 52.4% |
| Immigrants | Norway | 99.9 /100 | #48 | Exceptional 52.2% |
| Immigrants | Austria | 99.9 /100 | #49 | Exceptional 52.1% |