Lumbee vs Immigrants from Dominica Associate's Degree
COMPARE
Lumbee
Immigrants from Dominica
Associate's Degree
Associate's Degree Comparison
Lumbee
Immigrants from Dominica
34.1%
ASSOCIATE'S DEGREE
0.0/ 100
METRIC RATING
337th/ 347
METRIC RANK
40.5%
ASSOCIATE'S DEGREE
0.1/ 100
METRIC RATING
274th/ 347
METRIC RANK
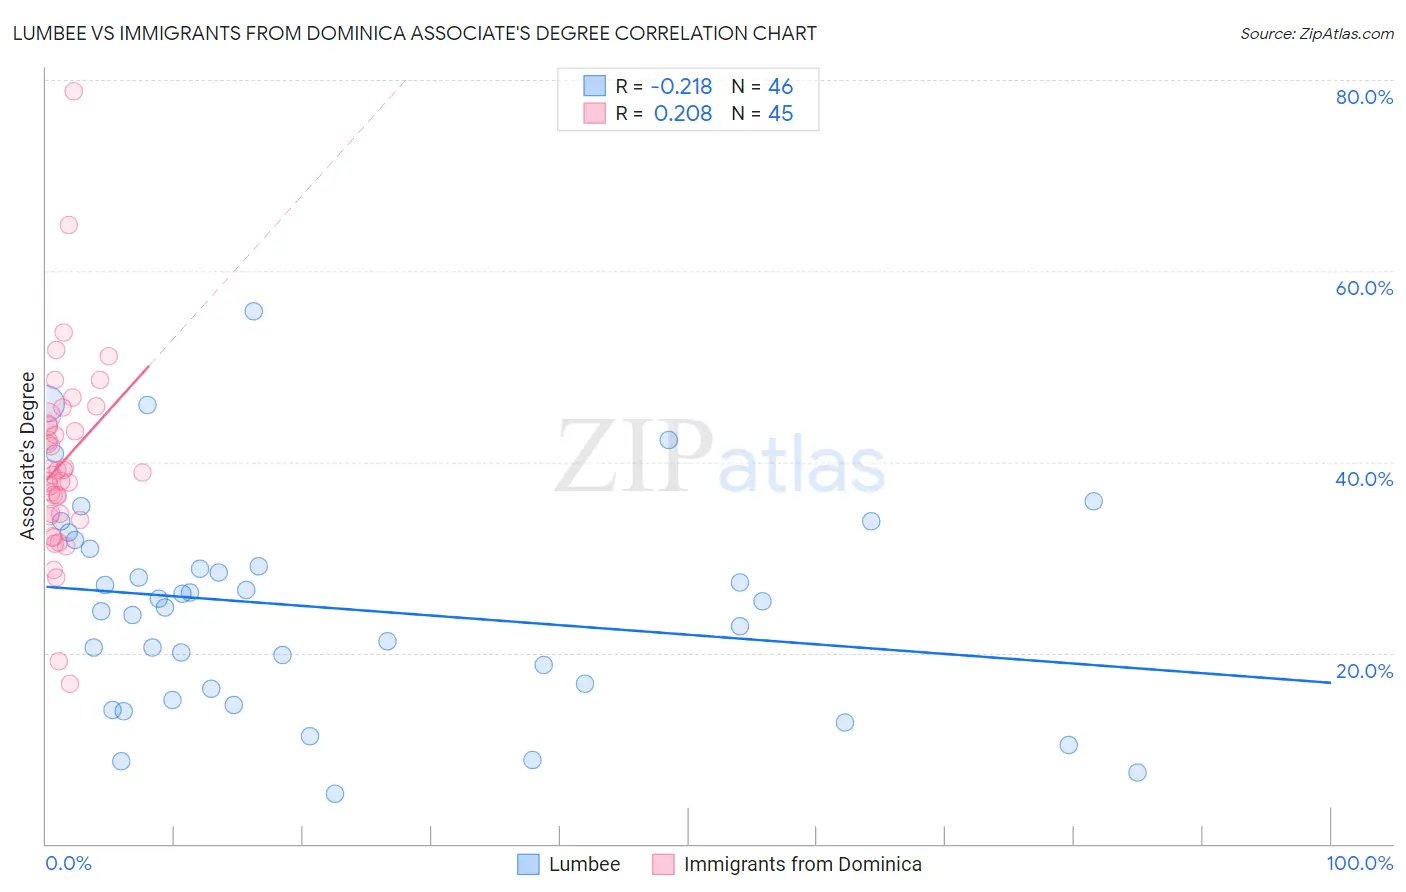
Lumbee vs Immigrants from Dominica Associate's Degree Correlation Chart
The statistical analysis conducted on geographies consisting of 92,299,068 people shows a weak negative correlation between the proportion of Lumbee and percentage of population with at least associate's degree education in the United States with a correlation coefficient (R) of -0.218 and weighted average of 34.1%. Similarly, the statistical analysis conducted on geographies consisting of 83,795,636 people shows a weak positive correlation between the proportion of Immigrants from Dominica and percentage of population with at least associate's degree education in the United States with a correlation coefficient (R) of 0.208 and weighted average of 40.5%, a difference of 18.6%.
Associate's Degree Correlation Summary
| Measurement | Lumbee | Immigrants from Dominica |
| Minimum | 5.2% | 16.7% |
| Maximum | 55.8% | 78.8% |
| Range | 50.6% | 62.1% |
| Mean | 24.7% | 40.0% |
| Median | 25.1% | 38.9% |
| Interquartile 25% (IQ1) | 16.2% | 34.4% |
| Interquartile 75% (IQ3) | 30.9% | 44.3% |
| Interquartile Range (IQR) | 14.7% | 9.9% |
| Standard Deviation (Sample) | 11.1% | 10.3% |
| Standard Deviation (Population) | 10.9% | 10.2% |
Similar Demographics by Associate's Degree
Demographics Similar to Lumbee by Associate's Degree
In terms of associate's degree, the demographic groups most similar to Lumbee are Pueblo (34.0%, a difference of 0.41%), Immigrants from Mexico (33.7%, a difference of 1.1%), Hopi (34.6%, a difference of 1.3%), Spanish American Indian (34.9%, a difference of 2.2%), and Native/Alaskan (34.9%, a difference of 2.3%).
| Demographics | Rating | Rank | Associate's Degree |
| Apache | 0.0 /100 | #330 | Tragic 36.2% |
| Immigrants | Azores | 0.0 /100 | #331 | Tragic 35.6% |
| Immigrants | Central America | 0.0 /100 | #332 | Tragic 35.0% |
| Mexicans | 0.0 /100 | #333 | Tragic 35.0% |
| Natives/Alaskans | 0.0 /100 | #334 | Tragic 34.9% |
| Spanish American Indians | 0.0 /100 | #335 | Tragic 34.9% |
| Hopi | 0.0 /100 | #336 | Tragic 34.6% |
| Lumbee | 0.0 /100 | #337 | Tragic 34.1% |
| Pueblo | 0.0 /100 | #338 | Tragic 34.0% |
| Immigrants | Mexico | 0.0 /100 | #339 | Tragic 33.7% |
| Navajo | 0.0 /100 | #340 | Tragic 32.6% |
| Inupiat | 0.0 /100 | #341 | Tragic 32.6% |
| Yakama | 0.0 /100 | #342 | Tragic 32.3% |
| Tohono O'odham | 0.0 /100 | #343 | Tragic 31.8% |
| Yuman | 0.0 /100 | #344 | Tragic 31.3% |
Demographics Similar to Immigrants from Dominica by Associate's Degree
In terms of associate's degree, the demographic groups most similar to Immigrants from Dominica are Puget Sound Salish (40.5%, a difference of 0.14%), Potawatomi (40.4%, a difference of 0.14%), Puerto Rican (40.4%, a difference of 0.25%), Blackfeet (40.3%, a difference of 0.30%), and Belizean (40.6%, a difference of 0.43%).
| Demographics | Rating | Rank | Associate's Degree |
| Hawaiians | 0.2 /100 | #267 | Tragic 40.9% |
| Central American Indians | 0.2 /100 | #268 | Tragic 40.8% |
| Americans | 0.2 /100 | #269 | Tragic 40.8% |
| Chippewa | 0.2 /100 | #270 | Tragic 40.7% |
| Immigrants | Laos | 0.1 /100 | #271 | Tragic 40.7% |
| Belizeans | 0.1 /100 | #272 | Tragic 40.6% |
| Puget Sound Salish | 0.1 /100 | #273 | Tragic 40.5% |
| Immigrants | Dominica | 0.1 /100 | #274 | Tragic 40.5% |
| Potawatomi | 0.1 /100 | #275 | Tragic 40.4% |
| Puerto Ricans | 0.1 /100 | #276 | Tragic 40.4% |
| Blackfeet | 0.1 /100 | #277 | Tragic 40.3% |
| Ottawa | 0.1 /100 | #278 | Tragic 40.3% |
| Immigrants | Nicaragua | 0.1 /100 | #279 | Tragic 40.3% |
| Immigrants | Micronesia | 0.1 /100 | #280 | Tragic 40.2% |
| Immigrants | Portugal | 0.1 /100 | #281 | Tragic 40.1% |