Tongan vs Immigrants from Fiji Associate's Degree
COMPARE
Tongan
Immigrants from Fiji
Associate's Degree
Associate's Degree Comparison
Tongans
Immigrants from Fiji
43.0%
ASSOCIATE'S DEGREE
2.2/ 100
METRIC RATING
233rd/ 347
METRIC RANK
42.2%
ASSOCIATE'S DEGREE
0.8/ 100
METRIC RATING
247th/ 347
METRIC RANK
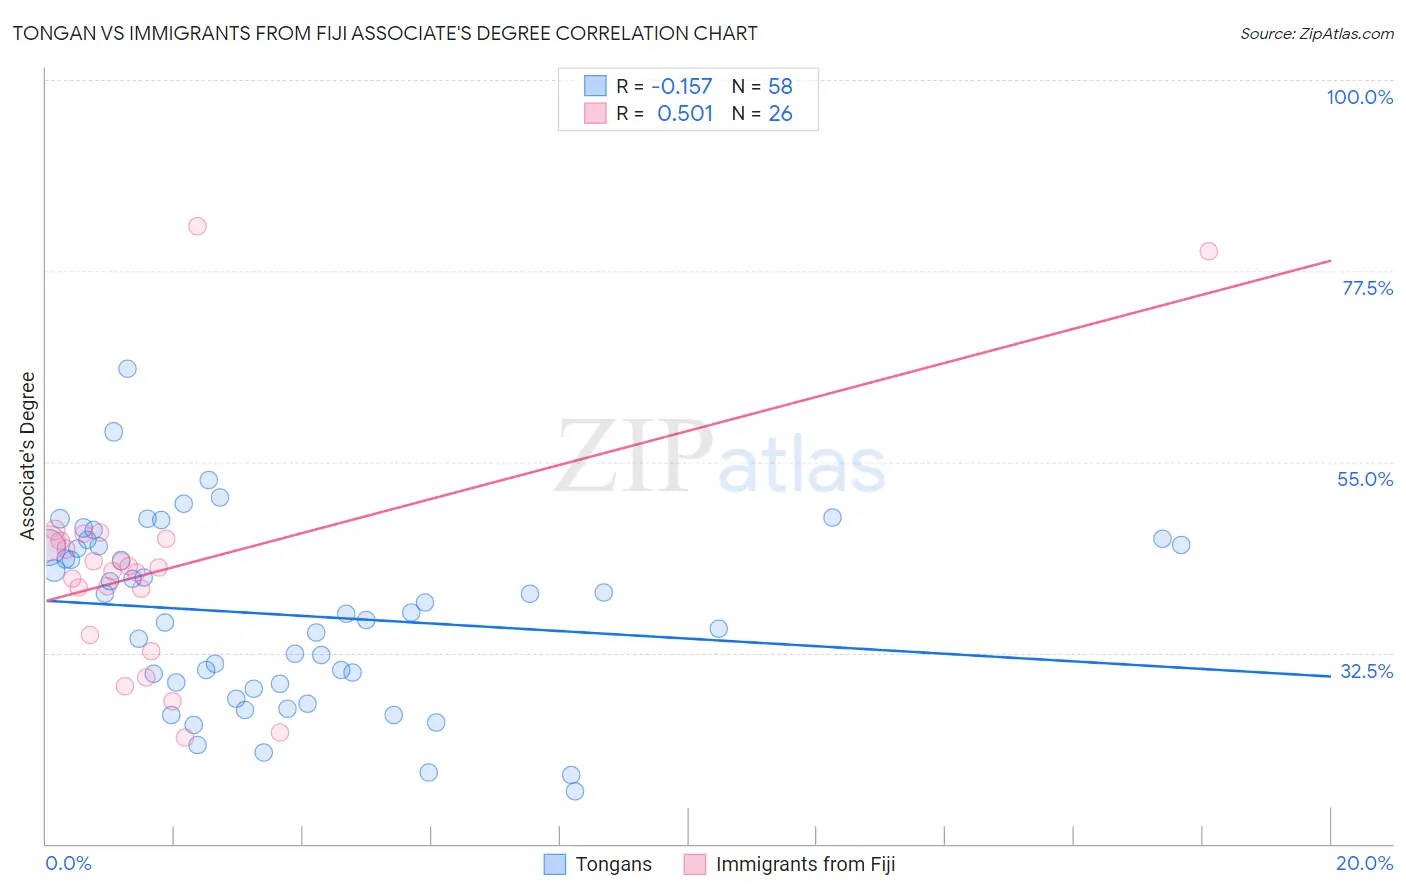
Tongan vs Immigrants from Fiji Associate's Degree Correlation Chart
The statistical analysis conducted on geographies consisting of 102,908,759 people shows a poor negative correlation between the proportion of Tongans and percentage of population with at least associate's degree education in the United States with a correlation coefficient (R) of -0.157 and weighted average of 43.0%. Similarly, the statistical analysis conducted on geographies consisting of 93,756,204 people shows a substantial positive correlation between the proportion of Immigrants from Fiji and percentage of population with at least associate's degree education in the United States with a correlation coefficient (R) of 0.501 and weighted average of 42.2%, a difference of 2.0%.
Associate's Degree Correlation Summary
| Measurement | Tongan | Immigrants from Fiji |
| Minimum | 16.2% | 22.5% |
| Maximum | 65.9% | 82.8% |
| Range | 49.7% | 60.3% |
| Mean | 37.0% | 42.3% |
| Median | 37.2% | 42.3% |
| Interquartile 25% (IQ1) | 28.9% | 34.6% |
| Interquartile 75% (IQ3) | 45.1% | 45.7% |
| Interquartile Range (IQR) | 16.2% | 11.1% |
| Standard Deviation (Sample) | 10.6% | 13.7% |
| Standard Deviation (Population) | 10.5% | 13.4% |
Demographics Similar to Tongans and Immigrants from Fiji by Associate's Degree
In terms of associate's degree, the demographic groups most similar to Tongans are Tlingit-Haida (43.0%, a difference of 0.090%), Native Hawaiian (43.1%, a difference of 0.16%), Ecuadorian (43.0%, a difference of 0.19%), Immigrants from St. Vincent and the Grenadines (42.9%, a difference of 0.27%), and Nonimmigrants (42.9%, a difference of 0.29%). Similarly, the demographic groups most similar to Immigrants from Fiji are Delaware (42.3%, a difference of 0.090%), Immigrants from Ecuador (42.2%, a difference of 0.090%), Immigrants from Cambodia (42.3%, a difference of 0.12%), Immigrants from Liberia (42.3%, a difference of 0.14%), and Jamaican (42.1%, a difference of 0.23%).
| Demographics | Rating | Rank | Associate's Degree |
| Immigrants | Barbados | 2.9 /100 | #230 | Tragic 43.3% |
| Liberians | 2.9 /100 | #231 | Tragic 43.3% |
| Native Hawaiians | 2.3 /100 | #232 | Tragic 43.1% |
| Tongans | 2.2 /100 | #233 | Tragic 43.0% |
| Tlingit-Haida | 2.1 /100 | #234 | Tragic 43.0% |
| Ecuadorians | 2.0 /100 | #235 | Tragic 43.0% |
| Immigrants | St. Vincent and the Grenadines | 1.9 /100 | #236 | Tragic 42.9% |
| Immigrants | Nonimmigrants | 1.9 /100 | #237 | Tragic 42.9% |
| Iroquois | 1.7 /100 | #238 | Tragic 42.8% |
| Immigrants | Grenada | 1.3 /100 | #239 | Tragic 42.6% |
| Cree | 1.2 /100 | #240 | Tragic 42.5% |
| British West Indians | 1.0 /100 | #241 | Tragic 42.4% |
| Immigrants | West Indies | 1.0 /100 | #242 | Tragic 42.4% |
| Guyanese | 1.0 /100 | #243 | Tragic 42.3% |
| Immigrants | Liberia | 0.9 /100 | #244 | Tragic 42.3% |
| Immigrants | Cambodia | 0.9 /100 | #245 | Tragic 42.3% |
| Delaware | 0.9 /100 | #246 | Tragic 42.3% |
| Immigrants | Fiji | 0.8 /100 | #247 | Tragic 42.2% |
| Immigrants | Ecuador | 0.8 /100 | #248 | Tragic 42.2% |
| Jamaicans | 0.7 /100 | #249 | Tragic 42.1% |
| U.S. Virgin Islanders | 0.7 /100 | #250 | Tragic 42.1% |