Ukrainian vs Immigrants from Fiji Associate's Degree
COMPARE
Ukrainian
Immigrants from Fiji
Associate's Degree
Associate's Degree Comparison
Ukrainians
Immigrants from Fiji
49.4%
ASSOCIATE'S DEGREE
97.1/ 100
METRIC RATING
103rd/ 347
METRIC RANK
42.2%
ASSOCIATE'S DEGREE
0.8/ 100
METRIC RATING
247th/ 347
METRIC RANK
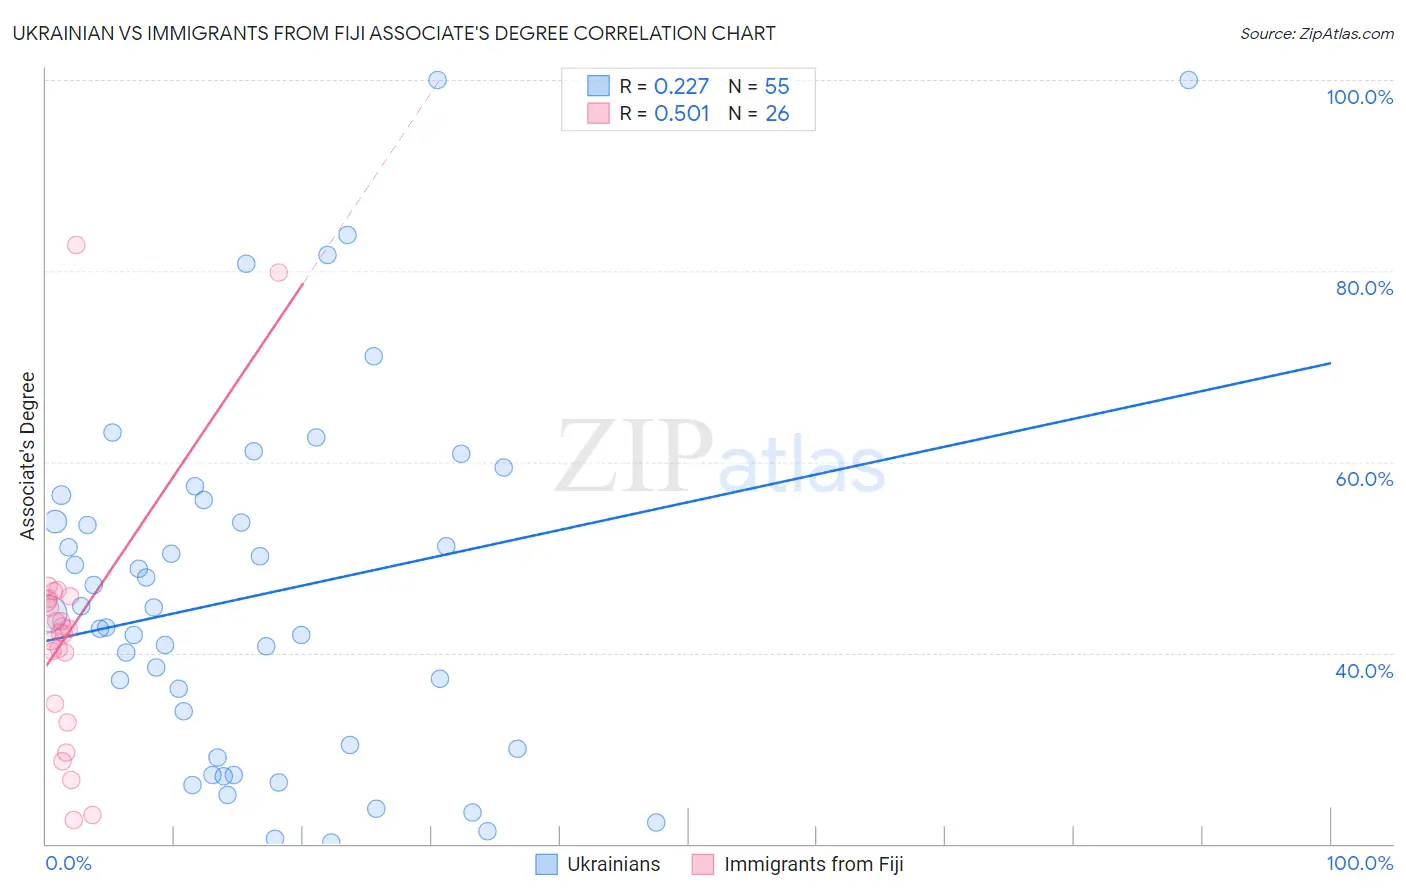
Ukrainian vs Immigrants from Fiji Associate's Degree Correlation Chart
The statistical analysis conducted on geographies consisting of 448,659,319 people shows a weak positive correlation between the proportion of Ukrainians and percentage of population with at least associate's degree education in the United States with a correlation coefficient (R) of 0.227 and weighted average of 49.4%. Similarly, the statistical analysis conducted on geographies consisting of 93,756,204 people shows a substantial positive correlation between the proportion of Immigrants from Fiji and percentage of population with at least associate's degree education in the United States with a correlation coefficient (R) of 0.501 and weighted average of 42.2%, a difference of 17.0%.
Associate's Degree Correlation Summary
| Measurement | Ukrainian | Immigrants from Fiji |
| Minimum | 20.1% | 22.5% |
| Maximum | 100.0% | 82.8% |
| Range | 79.9% | 60.3% |
| Mean | 46.1% | 42.3% |
| Median | 44.1% | 42.3% |
| Interquartile 25% (IQ1) | 30.0% | 34.6% |
| Interquartile 75% (IQ3) | 56.0% | 45.7% |
| Interquartile Range (IQR) | 26.0% | 11.1% |
| Standard Deviation (Sample) | 18.9% | 13.7% |
| Standard Deviation (Population) | 18.8% | 13.4% |
Similar Demographics by Associate's Degree
Demographics Similar to Ukrainians by Associate's Degree
In terms of associate's degree, the demographic groups most similar to Ukrainians are Venezuelan (49.4%, a difference of 0.060%), Chilean (49.4%, a difference of 0.11%), Northern European (49.5%, a difference of 0.13%), Croatian (49.3%, a difference of 0.21%), and Immigrants from Italy (49.3%, a difference of 0.21%).
| Demographics | Rating | Rank | Associate's Degree |
| Romanians | 98.0 /100 | #96 | Exceptional 49.7% |
| Immigrants | Ukraine | 98.0 /100 | #97 | Exceptional 49.7% |
| Immigrants | Northern Africa | 97.9 /100 | #98 | Exceptional 49.7% |
| Macedonians | 97.8 /100 | #99 | Exceptional 49.6% |
| Immigrants | Nepal | 97.5 /100 | #100 | Exceptional 49.5% |
| Northern Europeans | 97.3 /100 | #101 | Exceptional 49.5% |
| Chileans | 97.3 /100 | #102 | Exceptional 49.4% |
| Ukrainians | 97.1 /100 | #103 | Exceptional 49.4% |
| Venezuelans | 97.0 /100 | #104 | Exceptional 49.4% |
| Croatians | 96.8 /100 | #105 | Exceptional 49.3% |
| Immigrants | Italy | 96.7 /100 | #106 | Exceptional 49.3% |
| Syrians | 96.7 /100 | #107 | Exceptional 49.3% |
| Jordanians | 96.6 /100 | #108 | Exceptional 49.2% |
| Immigrants | Morocco | 96.3 /100 | #109 | Exceptional 49.2% |
| Austrians | 95.8 /100 | #110 | Exceptional 49.1% |
Demographics Similar to Immigrants from Fiji by Associate's Degree
In terms of associate's degree, the demographic groups most similar to Immigrants from Fiji are Delaware (42.3%, a difference of 0.090%), Immigrants from Ecuador (42.2%, a difference of 0.090%), Immigrants from Cambodia (42.3%, a difference of 0.12%), Immigrants from Liberia (42.3%, a difference of 0.14%), and Jamaican (42.1%, a difference of 0.23%).
| Demographics | Rating | Rank | Associate's Degree |
| Cree | 1.2 /100 | #240 | Tragic 42.5% |
| British West Indians | 1.0 /100 | #241 | Tragic 42.4% |
| Immigrants | West Indies | 1.0 /100 | #242 | Tragic 42.4% |
| Guyanese | 1.0 /100 | #243 | Tragic 42.3% |
| Immigrants | Liberia | 0.9 /100 | #244 | Tragic 42.3% |
| Immigrants | Cambodia | 0.9 /100 | #245 | Tragic 42.3% |
| Delaware | 0.9 /100 | #246 | Tragic 42.3% |
| Immigrants | Fiji | 0.8 /100 | #247 | Tragic 42.2% |
| Immigrants | Ecuador | 0.8 /100 | #248 | Tragic 42.2% |
| Jamaicans | 0.7 /100 | #249 | Tragic 42.1% |
| U.S. Virgin Islanders | 0.7 /100 | #250 | Tragic 42.1% |
| Immigrants | Bahamas | 0.7 /100 | #251 | Tragic 42.1% |
| French American Indians | 0.6 /100 | #252 | Tragic 42.0% |
| Indonesians | 0.6 /100 | #253 | Tragic 41.9% |
| Cubans | 0.6 /100 | #254 | Tragic 41.9% |