Immigrants from Sudan vs Immigrants from Fiji Associate's Degree
COMPARE
Immigrants from Sudan
Immigrants from Fiji
Associate's Degree
Associate's Degree Comparison
Immigrants from Sudan
Immigrants from Fiji
47.4%
ASSOCIATE'S DEGREE
77.9/ 100
METRIC RATING
146th/ 347
METRIC RANK
42.2%
ASSOCIATE'S DEGREE
0.8/ 100
METRIC RATING
247th/ 347
METRIC RANK
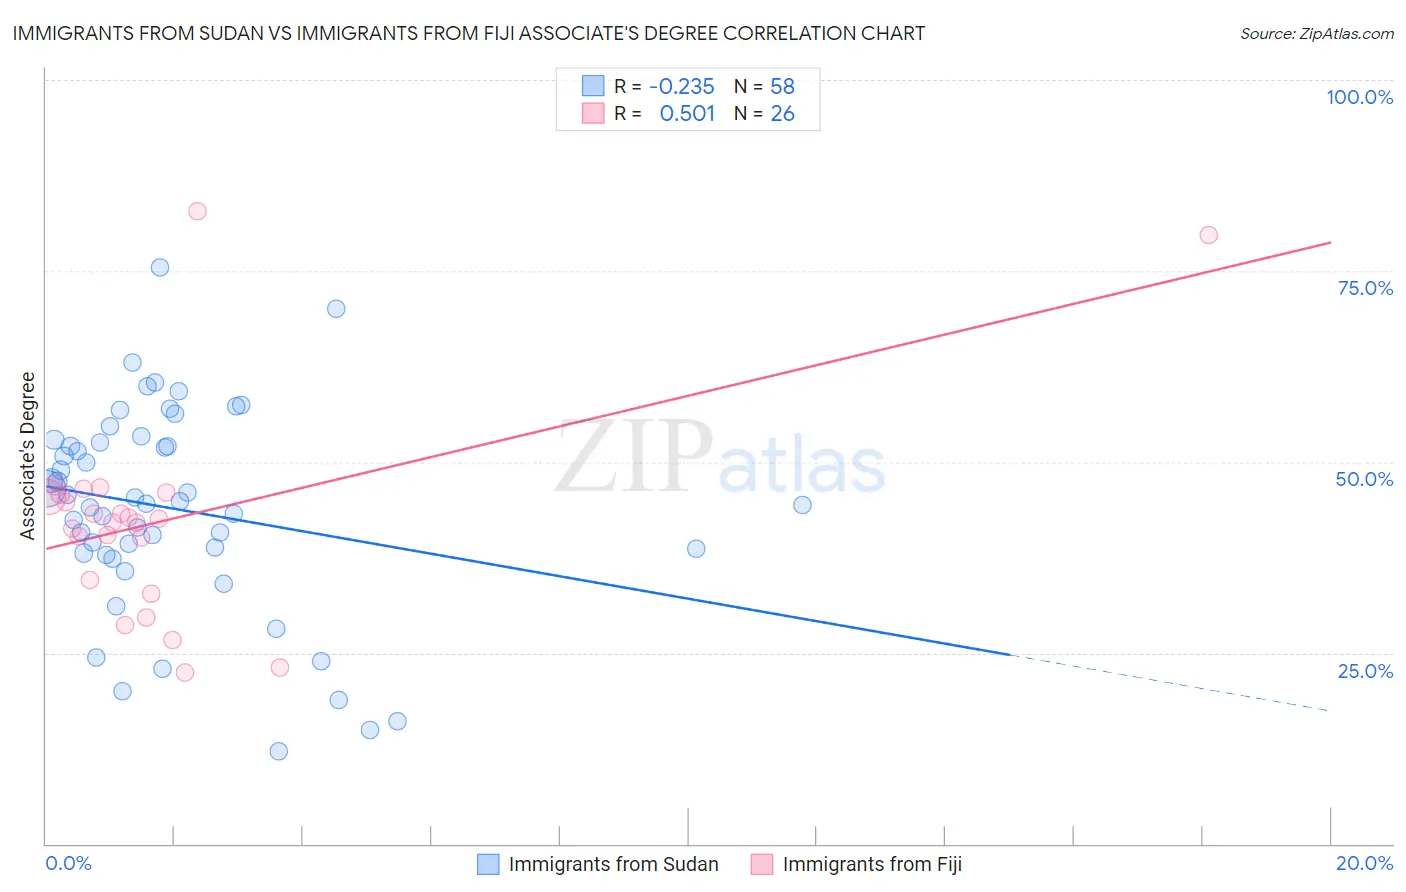
Immigrants from Sudan vs Immigrants from Fiji Associate's Degree Correlation Chart
The statistical analysis conducted on geographies consisting of 118,972,993 people shows a weak negative correlation between the proportion of Immigrants from Sudan and percentage of population with at least associate's degree education in the United States with a correlation coefficient (R) of -0.235 and weighted average of 47.4%. Similarly, the statistical analysis conducted on geographies consisting of 93,756,204 people shows a substantial positive correlation between the proportion of Immigrants from Fiji and percentage of population with at least associate's degree education in the United States with a correlation coefficient (R) of 0.501 and weighted average of 42.2%, a difference of 12.4%.
Associate's Degree Correlation Summary
| Measurement | Immigrants from Sudan | Immigrants from Fiji |
| Minimum | 12.1% | 22.5% |
| Maximum | 75.4% | 82.8% |
| Range | 63.3% | 60.3% |
| Mean | 43.8% | 42.3% |
| Median | 44.7% | 42.3% |
| Interquartile 25% (IQ1) | 38.1% | 34.6% |
| Interquartile 75% (IQ3) | 52.5% | 45.7% |
| Interquartile Range (IQR) | 14.4% | 11.1% |
| Standard Deviation (Sample) | 13.4% | 13.7% |
| Standard Deviation (Population) | 13.3% | 13.4% |
Similar Demographics by Associate's Degree
Demographics Similar to Immigrants from Sudan by Associate's Degree
In terms of associate's degree, the demographic groups most similar to Immigrants from Sudan are Danish (47.4%, a difference of 0.050%), South American Indian (47.4%, a difference of 0.12%), Canadian (47.5%, a difference of 0.13%), Immigrants from Armenia (47.4%, a difference of 0.13%), and Iraqi (47.4%, a difference of 0.17%).
| Demographics | Rating | Rank | Associate's Degree |
| Slovenes | 85.1 /100 | #139 | Excellent 47.9% |
| Immigrants | Southern Europe | 84.4 /100 | #140 | Excellent 47.8% |
| Taiwanese | 83.3 /100 | #141 | Excellent 47.7% |
| Sierra Leoneans | 82.9 /100 | #142 | Excellent 47.7% |
| Norwegians | 81.0 /100 | #143 | Excellent 47.6% |
| Slavs | 80.5 /100 | #144 | Excellent 47.6% |
| Canadians | 79.0 /100 | #145 | Good 47.5% |
| Immigrants | Sudan | 77.9 /100 | #146 | Good 47.4% |
| Danes | 77.3 /100 | #147 | Good 47.4% |
| South American Indians | 76.7 /100 | #148 | Good 47.4% |
| Immigrants | Armenia | 76.6 /100 | #149 | Good 47.4% |
| Iraqis | 76.2 /100 | #150 | Good 47.4% |
| Immigrants | North Macedonia | 76.0 /100 | #151 | Good 47.4% |
| Immigrants | Afghanistan | 74.3 /100 | #152 | Good 47.3% |
| Czechs | 72.2 /100 | #153 | Good 47.2% |
Demographics Similar to Immigrants from Fiji by Associate's Degree
In terms of associate's degree, the demographic groups most similar to Immigrants from Fiji are Delaware (42.3%, a difference of 0.090%), Immigrants from Ecuador (42.2%, a difference of 0.090%), Immigrants from Cambodia (42.3%, a difference of 0.12%), Immigrants from Liberia (42.3%, a difference of 0.14%), and Jamaican (42.1%, a difference of 0.23%).
| Demographics | Rating | Rank | Associate's Degree |
| Cree | 1.2 /100 | #240 | Tragic 42.5% |
| British West Indians | 1.0 /100 | #241 | Tragic 42.4% |
| Immigrants | West Indies | 1.0 /100 | #242 | Tragic 42.4% |
| Guyanese | 1.0 /100 | #243 | Tragic 42.3% |
| Immigrants | Liberia | 0.9 /100 | #244 | Tragic 42.3% |
| Immigrants | Cambodia | 0.9 /100 | #245 | Tragic 42.3% |
| Delaware | 0.9 /100 | #246 | Tragic 42.3% |
| Immigrants | Fiji | 0.8 /100 | #247 | Tragic 42.2% |
| Immigrants | Ecuador | 0.8 /100 | #248 | Tragic 42.2% |
| Jamaicans | 0.7 /100 | #249 | Tragic 42.1% |
| U.S. Virgin Islanders | 0.7 /100 | #250 | Tragic 42.1% |
| Immigrants | Bahamas | 0.7 /100 | #251 | Tragic 42.1% |
| French American Indians | 0.6 /100 | #252 | Tragic 42.0% |
| Indonesians | 0.6 /100 | #253 | Tragic 41.9% |
| Cubans | 0.6 /100 | #254 | Tragic 41.9% |