Lumbee vs Immigrants from Haiti Associate's Degree
COMPARE
Lumbee
Immigrants from Haiti
Associate's Degree
Associate's Degree Comparison
Lumbee
Immigrants from Haiti
34.1%
ASSOCIATE'S DEGREE
0.0/ 100
METRIC RATING
337th/ 347
METRIC RANK
39.3%
ASSOCIATE'S DEGREE
0.0/ 100
METRIC RATING
290th/ 347
METRIC RANK
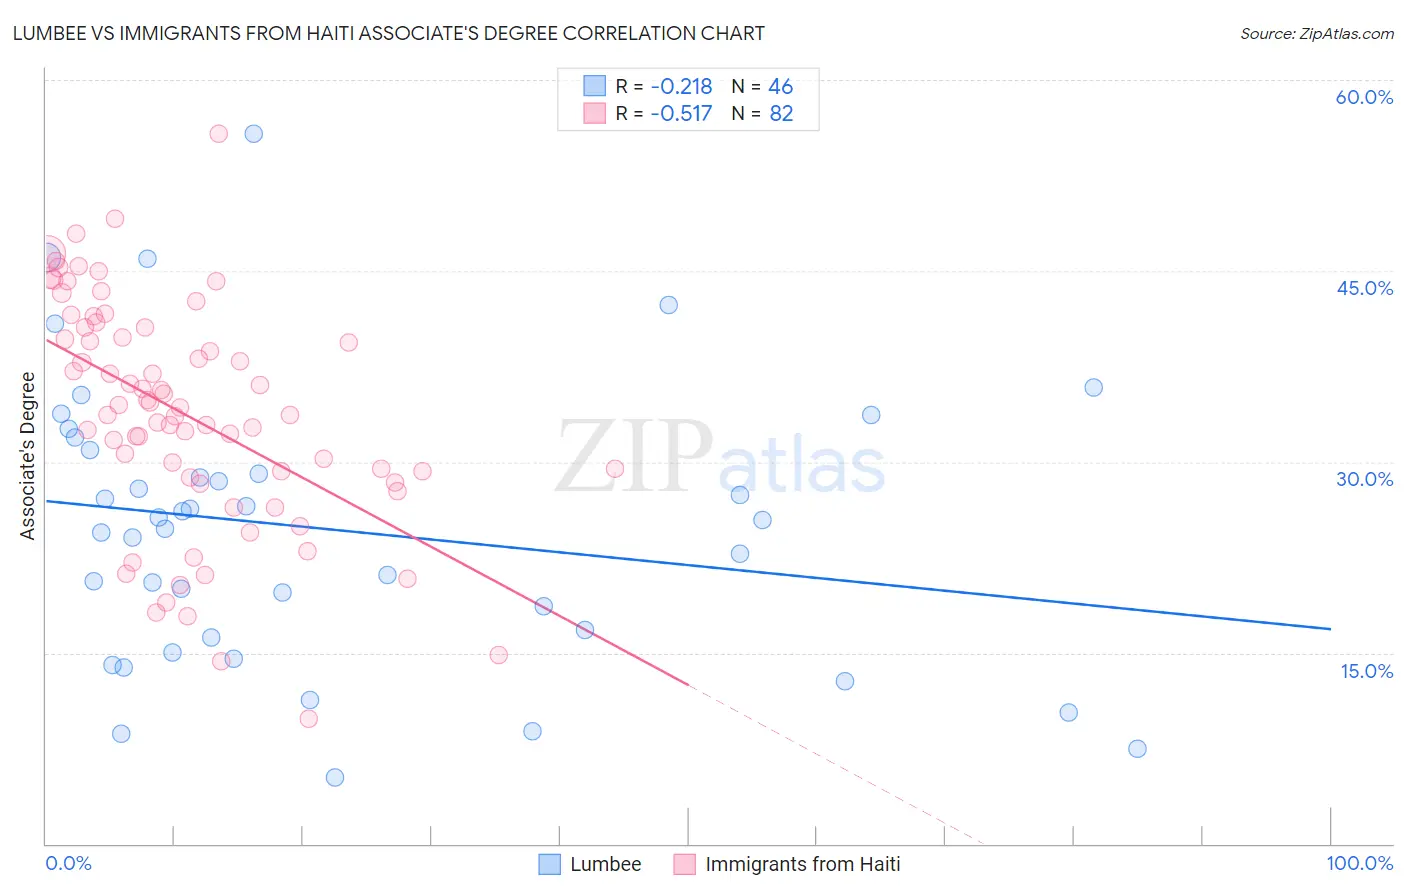
Lumbee vs Immigrants from Haiti Associate's Degree Correlation Chart
The statistical analysis conducted on geographies consisting of 92,299,068 people shows a weak negative correlation between the proportion of Lumbee and percentage of population with at least associate's degree education in the United States with a correlation coefficient (R) of -0.218 and weighted average of 34.1%. Similarly, the statistical analysis conducted on geographies consisting of 225,274,856 people shows a substantial negative correlation between the proportion of Immigrants from Haiti and percentage of population with at least associate's degree education in the United States with a correlation coefficient (R) of -0.517 and weighted average of 39.3%, a difference of 15.1%.
Associate's Degree Correlation Summary
| Measurement | Lumbee | Immigrants from Haiti |
| Minimum | 5.2% | 9.8% |
| Maximum | 55.8% | 55.8% |
| Range | 50.6% | 46.0% |
| Mean | 24.7% | 33.7% |
| Median | 25.1% | 34.0% |
| Interquartile 25% (IQ1) | 16.2% | 28.8% |
| Interquartile 75% (IQ3) | 30.9% | 40.6% |
| Interquartile Range (IQR) | 14.7% | 11.7% |
| Standard Deviation (Sample) | 11.1% | 9.0% |
| Standard Deviation (Population) | 10.9% | 8.9% |
Similar Demographics by Associate's Degree
Demographics Similar to Lumbee by Associate's Degree
In terms of associate's degree, the demographic groups most similar to Lumbee are Pueblo (34.0%, a difference of 0.41%), Immigrants from Mexico (33.7%, a difference of 1.1%), Hopi (34.6%, a difference of 1.3%), Spanish American Indian (34.9%, a difference of 2.2%), and Native/Alaskan (34.9%, a difference of 2.3%).
| Demographics | Rating | Rank | Associate's Degree |
| Apache | 0.0 /100 | #330 | Tragic 36.2% |
| Immigrants | Azores | 0.0 /100 | #331 | Tragic 35.6% |
| Immigrants | Central America | 0.0 /100 | #332 | Tragic 35.0% |
| Mexicans | 0.0 /100 | #333 | Tragic 35.0% |
| Natives/Alaskans | 0.0 /100 | #334 | Tragic 34.9% |
| Spanish American Indians | 0.0 /100 | #335 | Tragic 34.9% |
| Hopi | 0.0 /100 | #336 | Tragic 34.6% |
| Lumbee | 0.0 /100 | #337 | Tragic 34.1% |
| Pueblo | 0.0 /100 | #338 | Tragic 34.0% |
| Immigrants | Mexico | 0.0 /100 | #339 | Tragic 33.7% |
| Navajo | 0.0 /100 | #340 | Tragic 32.6% |
| Inupiat | 0.0 /100 | #341 | Tragic 32.6% |
| Yakama | 0.0 /100 | #342 | Tragic 32.3% |
| Tohono O'odham | 0.0 /100 | #343 | Tragic 31.8% |
| Yuman | 0.0 /100 | #344 | Tragic 31.3% |
Demographics Similar to Immigrants from Haiti by Associate's Degree
In terms of associate's degree, the demographic groups most similar to Immigrants from Haiti are Dominican (39.3%, a difference of 0.010%), Black/African American (39.1%, a difference of 0.30%), Central American (39.4%, a difference of 0.44%), Nepalese (39.0%, a difference of 0.55%), and Salvadoran (39.0%, a difference of 0.55%).
| Demographics | Rating | Rank | Associate's Degree |
| Haitians | 0.1 /100 | #283 | Tragic 40.0% |
| Comanche | 0.1 /100 | #284 | Tragic 39.9% |
| Immigrants | Belize | 0.1 /100 | #285 | Tragic 39.9% |
| Immigrants | Caribbean | 0.0 /100 | #286 | Tragic 39.7% |
| Aleuts | 0.0 /100 | #287 | Tragic 39.6% |
| Immigrants | Cuba | 0.0 /100 | #288 | Tragic 39.5% |
| Central Americans | 0.0 /100 | #289 | Tragic 39.4% |
| Immigrants | Haiti | 0.0 /100 | #290 | Tragic 39.3% |
| Dominicans | 0.0 /100 | #291 | Tragic 39.3% |
| Blacks/African Americans | 0.0 /100 | #292 | Tragic 39.1% |
| Nepalese | 0.0 /100 | #293 | Tragic 39.0% |
| Salvadorans | 0.0 /100 | #294 | Tragic 39.0% |
| Hondurans | 0.0 /100 | #295 | Tragic 38.9% |
| Cherokee | 0.0 /100 | #296 | Tragic 38.9% |
| Cape Verdeans | 0.0 /100 | #297 | Tragic 38.8% |