Russian vs Immigrants from Fiji Associate's Degree
COMPARE
Russian
Immigrants from Fiji
Associate's Degree
Associate's Degree Comparison
Russians
Immigrants from Fiji
53.2%
ASSOCIATE'S DEGREE
100.0/ 100
METRIC RATING
35th/ 347
METRIC RANK
42.2%
ASSOCIATE'S DEGREE
0.8/ 100
METRIC RATING
247th/ 347
METRIC RANK
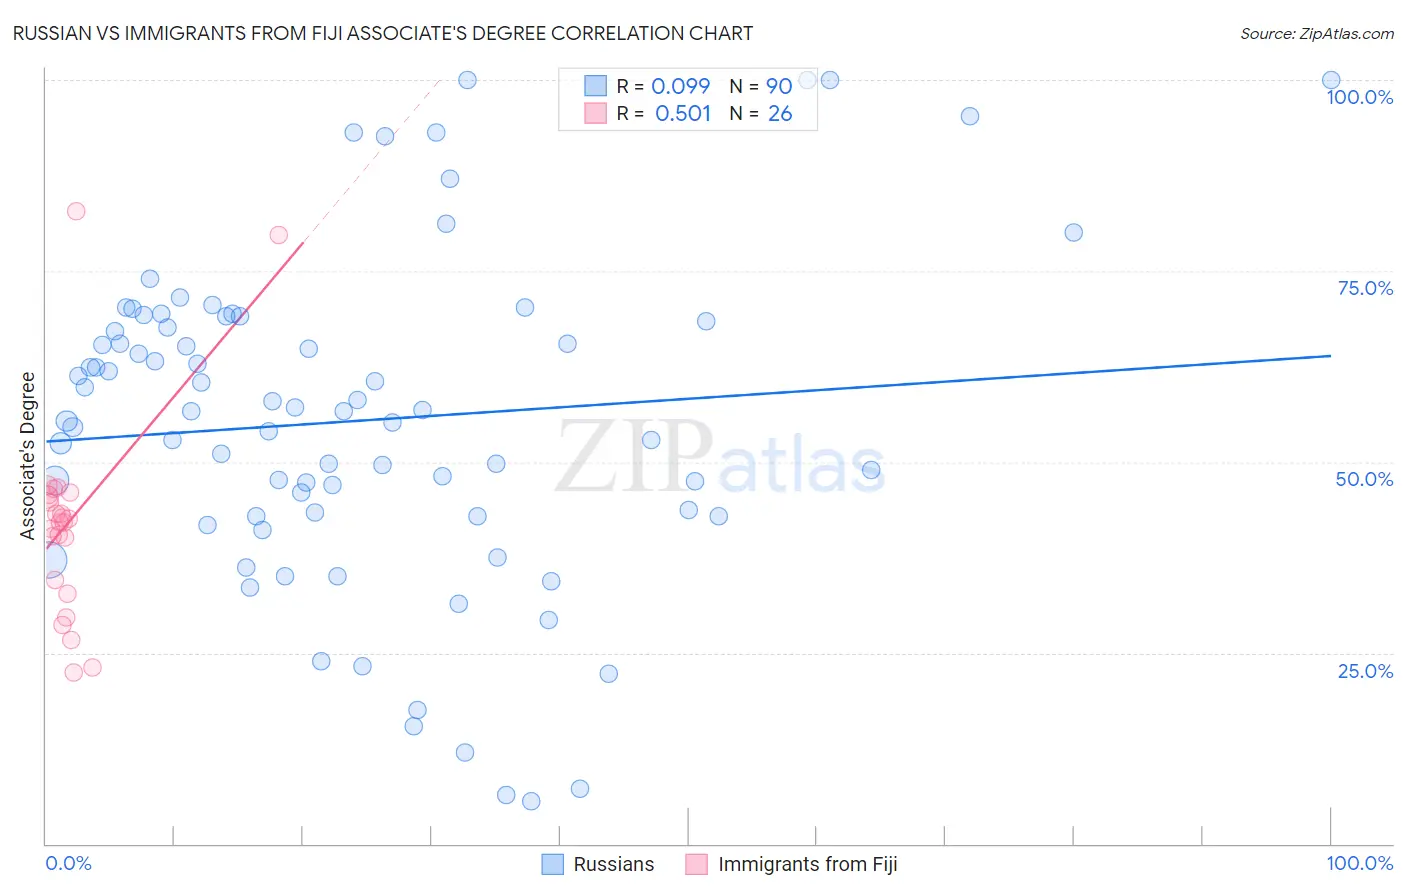
Russian vs Immigrants from Fiji Associate's Degree Correlation Chart
The statistical analysis conducted on geographies consisting of 512,209,602 people shows a slight positive correlation between the proportion of Russians and percentage of population with at least associate's degree education in the United States with a correlation coefficient (R) of 0.099 and weighted average of 53.2%. Similarly, the statistical analysis conducted on geographies consisting of 93,756,204 people shows a substantial positive correlation between the proportion of Immigrants from Fiji and percentage of population with at least associate's degree education in the United States with a correlation coefficient (R) of 0.501 and weighted average of 42.2%, a difference of 26.1%.
Associate's Degree Correlation Summary
| Measurement | Russian | Immigrants from Fiji |
| Minimum | 5.6% | 22.5% |
| Maximum | 100.0% | 82.8% |
| Range | 94.4% | 60.3% |
| Mean | 55.4% | 42.3% |
| Median | 56.6% | 42.3% |
| Interquartile 25% (IQ1) | 42.9% | 34.6% |
| Interquartile 75% (IQ3) | 68.4% | 45.7% |
| Interquartile Range (IQR) | 25.5% | 11.1% |
| Standard Deviation (Sample) | 21.5% | 13.7% |
| Standard Deviation (Population) | 21.3% | 13.4% |
Similar Demographics by Associate's Degree
Demographics Similar to Russians by Associate's Degree
In terms of associate's degree, the demographic groups most similar to Russians are Bulgarian (53.3%, a difference of 0.060%), Israeli (53.4%, a difference of 0.26%), Immigrants from Russia (53.1%, a difference of 0.28%), Immigrants from Denmark (53.1%, a difference of 0.36%), and Immigrants from Turkey (53.4%, a difference of 0.38%).
| Demographics | Rating | Rank | Associate's Degree |
| Turks | 100.0 /100 | #28 | Exceptional 53.9% |
| Immigrants | France | 100.0 /100 | #29 | Exceptional 53.9% |
| Immigrants | Sri Lanka | 100.0 /100 | #30 | Exceptional 53.7% |
| Immigrants | Northern Europe | 100.0 /100 | #31 | Exceptional 53.5% |
| Immigrants | Turkey | 100.0 /100 | #32 | Exceptional 53.4% |
| Israelis | 100.0 /100 | #33 | Exceptional 53.4% |
| Bulgarians | 100.0 /100 | #34 | Exceptional 53.3% |
| Russians | 100.0 /100 | #35 | Exceptional 53.2% |
| Immigrants | Russia | 100.0 /100 | #36 | Exceptional 53.1% |
| Immigrants | Denmark | 100.0 /100 | #37 | Exceptional 53.1% |
| Mongolians | 100.0 /100 | #38 | Exceptional 53.0% |
| Immigrants | Belarus | 99.9 /100 | #39 | Exceptional 52.8% |
| Immigrants | Latvia | 99.9 /100 | #40 | Exceptional 52.8% |
| Immigrants | Saudi Arabia | 99.9 /100 | #41 | Exceptional 52.6% |
| Immigrants | Malaysia | 99.9 /100 | #42 | Exceptional 52.5% |
Demographics Similar to Immigrants from Fiji by Associate's Degree
In terms of associate's degree, the demographic groups most similar to Immigrants from Fiji are Delaware (42.3%, a difference of 0.090%), Immigrants from Ecuador (42.2%, a difference of 0.090%), Immigrants from Cambodia (42.3%, a difference of 0.12%), Immigrants from Liberia (42.3%, a difference of 0.14%), and Jamaican (42.1%, a difference of 0.23%).
| Demographics | Rating | Rank | Associate's Degree |
| Cree | 1.2 /100 | #240 | Tragic 42.5% |
| British West Indians | 1.0 /100 | #241 | Tragic 42.4% |
| Immigrants | West Indies | 1.0 /100 | #242 | Tragic 42.4% |
| Guyanese | 1.0 /100 | #243 | Tragic 42.3% |
| Immigrants | Liberia | 0.9 /100 | #244 | Tragic 42.3% |
| Immigrants | Cambodia | 0.9 /100 | #245 | Tragic 42.3% |
| Delaware | 0.9 /100 | #246 | Tragic 42.3% |
| Immigrants | Fiji | 0.8 /100 | #247 | Tragic 42.2% |
| Immigrants | Ecuador | 0.8 /100 | #248 | Tragic 42.2% |
| Jamaicans | 0.7 /100 | #249 | Tragic 42.1% |
| U.S. Virgin Islanders | 0.7 /100 | #250 | Tragic 42.1% |
| Immigrants | Bahamas | 0.7 /100 | #251 | Tragic 42.1% |
| French American Indians | 0.6 /100 | #252 | Tragic 42.0% |
| Indonesians | 0.6 /100 | #253 | Tragic 41.9% |
| Cubans | 0.6 /100 | #254 | Tragic 41.9% |