Lumbee vs Immigrants from Eastern Africa Associate's Degree
COMPARE
Lumbee
Immigrants from Eastern Africa
Associate's Degree
Associate's Degree Comparison
Lumbee
Immigrants from Eastern Africa
34.1%
ASSOCIATE'S DEGREE
0.0/ 100
METRIC RATING
337th/ 347
METRIC RANK
48.4%
ASSOCIATE'S DEGREE
91.6/ 100
METRIC RATING
128th/ 347
METRIC RANK
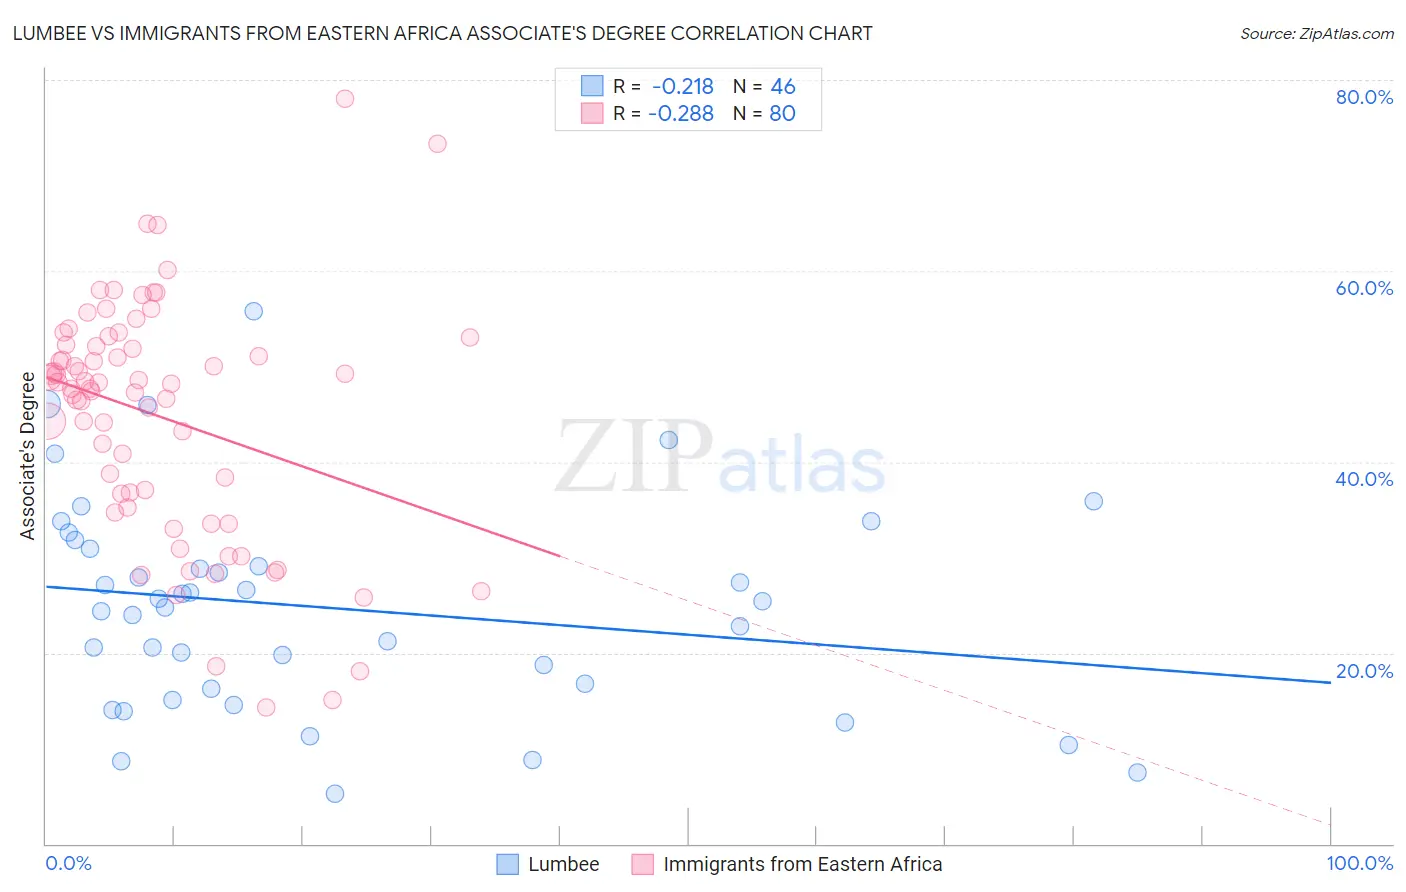
Lumbee vs Immigrants from Eastern Africa Associate's Degree Correlation Chart
The statistical analysis conducted on geographies consisting of 92,299,068 people shows a weak negative correlation between the proportion of Lumbee and percentage of population with at least associate's degree education in the United States with a correlation coefficient (R) of -0.218 and weighted average of 34.1%. Similarly, the statistical analysis conducted on geographies consisting of 355,139,091 people shows a weak negative correlation between the proportion of Immigrants from Eastern Africa and percentage of population with at least associate's degree education in the United States with a correlation coefficient (R) of -0.288 and weighted average of 48.4%, a difference of 42.0%.
Associate's Degree Correlation Summary
| Measurement | Lumbee | Immigrants from Eastern Africa |
| Minimum | 5.2% | 14.3% |
| Maximum | 55.8% | 78.0% |
| Range | 50.6% | 63.7% |
| Mean | 24.7% | 44.8% |
| Median | 25.1% | 47.9% |
| Interquartile 25% (IQ1) | 16.2% | 35.9% |
| Interquartile 75% (IQ3) | 30.9% | 52.2% |
| Interquartile Range (IQR) | 14.7% | 16.2% |
| Standard Deviation (Sample) | 11.1% | 12.5% |
| Standard Deviation (Population) | 10.9% | 12.4% |
Similar Demographics by Associate's Degree
Demographics Similar to Lumbee by Associate's Degree
In terms of associate's degree, the demographic groups most similar to Lumbee are Pueblo (34.0%, a difference of 0.41%), Immigrants from Mexico (33.7%, a difference of 1.1%), Hopi (34.6%, a difference of 1.3%), Spanish American Indian (34.9%, a difference of 2.2%), and Native/Alaskan (34.9%, a difference of 2.3%).
| Demographics | Rating | Rank | Associate's Degree |
| Apache | 0.0 /100 | #330 | Tragic 36.2% |
| Immigrants | Azores | 0.0 /100 | #331 | Tragic 35.6% |
| Immigrants | Central America | 0.0 /100 | #332 | Tragic 35.0% |
| Mexicans | 0.0 /100 | #333 | Tragic 35.0% |
| Natives/Alaskans | 0.0 /100 | #334 | Tragic 34.9% |
| Spanish American Indians | 0.0 /100 | #335 | Tragic 34.9% |
| Hopi | 0.0 /100 | #336 | Tragic 34.6% |
| Lumbee | 0.0 /100 | #337 | Tragic 34.1% |
| Pueblo | 0.0 /100 | #338 | Tragic 34.0% |
| Immigrants | Mexico | 0.0 /100 | #339 | Tragic 33.7% |
| Navajo | 0.0 /100 | #340 | Tragic 32.6% |
| Inupiat | 0.0 /100 | #341 | Tragic 32.6% |
| Yakama | 0.0 /100 | #342 | Tragic 32.3% |
| Tohono O'odham | 0.0 /100 | #343 | Tragic 31.8% |
| Yuman | 0.0 /100 | #344 | Tragic 31.3% |
Demographics Similar to Immigrants from Eastern Africa by Associate's Degree
In terms of associate's degree, the demographic groups most similar to Immigrants from Eastern Africa are Swedish (48.4%, a difference of 0.030%), Immigrants from Jordan (48.4%, a difference of 0.090%), Immigrants from Uganda (48.5%, a difference of 0.12%), Immigrants from Syria (48.5%, a difference of 0.13%), and Icelander (48.3%, a difference of 0.19%).
| Demographics | Rating | Rank | Associate's Degree |
| Ugandans | 93.9 /100 | #121 | Exceptional 48.7% |
| Italians | 93.9 /100 | #122 | Exceptional 48.7% |
| Brazilians | 93.7 /100 | #123 | Exceptional 48.7% |
| Serbians | 92.6 /100 | #124 | Exceptional 48.5% |
| Chinese | 92.5 /100 | #125 | Exceptional 48.5% |
| Immigrants | Syria | 92.2 /100 | #126 | Exceptional 48.5% |
| Immigrants | Uganda | 92.1 /100 | #127 | Exceptional 48.5% |
| Immigrants | Eastern Africa | 91.6 /100 | #128 | Exceptional 48.4% |
| Swedes | 91.5 /100 | #129 | Exceptional 48.4% |
| Immigrants | Jordan | 91.2 /100 | #130 | Exceptional 48.4% |
| Icelanders | 90.8 /100 | #131 | Exceptional 48.3% |
| Immigrants | Albania | 89.9 /100 | #132 | Excellent 48.2% |
| Assyrians/Chaldeans/Syriacs | 89.4 /100 | #133 | Excellent 48.2% |
| Moroccans | 89.3 /100 | #134 | Excellent 48.2% |
| Europeans | 89.0 /100 | #135 | Excellent 48.2% |