Lithuanian vs Immigrants from Grenada GED/Equivalency
COMPARE
Lithuanian
Immigrants from Grenada
GED/Equivalency
GED/Equivalency Comparison
Lithuanians
Immigrants from Grenada
88.9%
GED/EQUIVALENCY
99.9/ 100
METRIC RATING
12th/ 347
METRIC RANK
81.3%
GED/EQUIVALENCY
0.0/ 100
METRIC RATING
305th/ 347
METRIC RANK
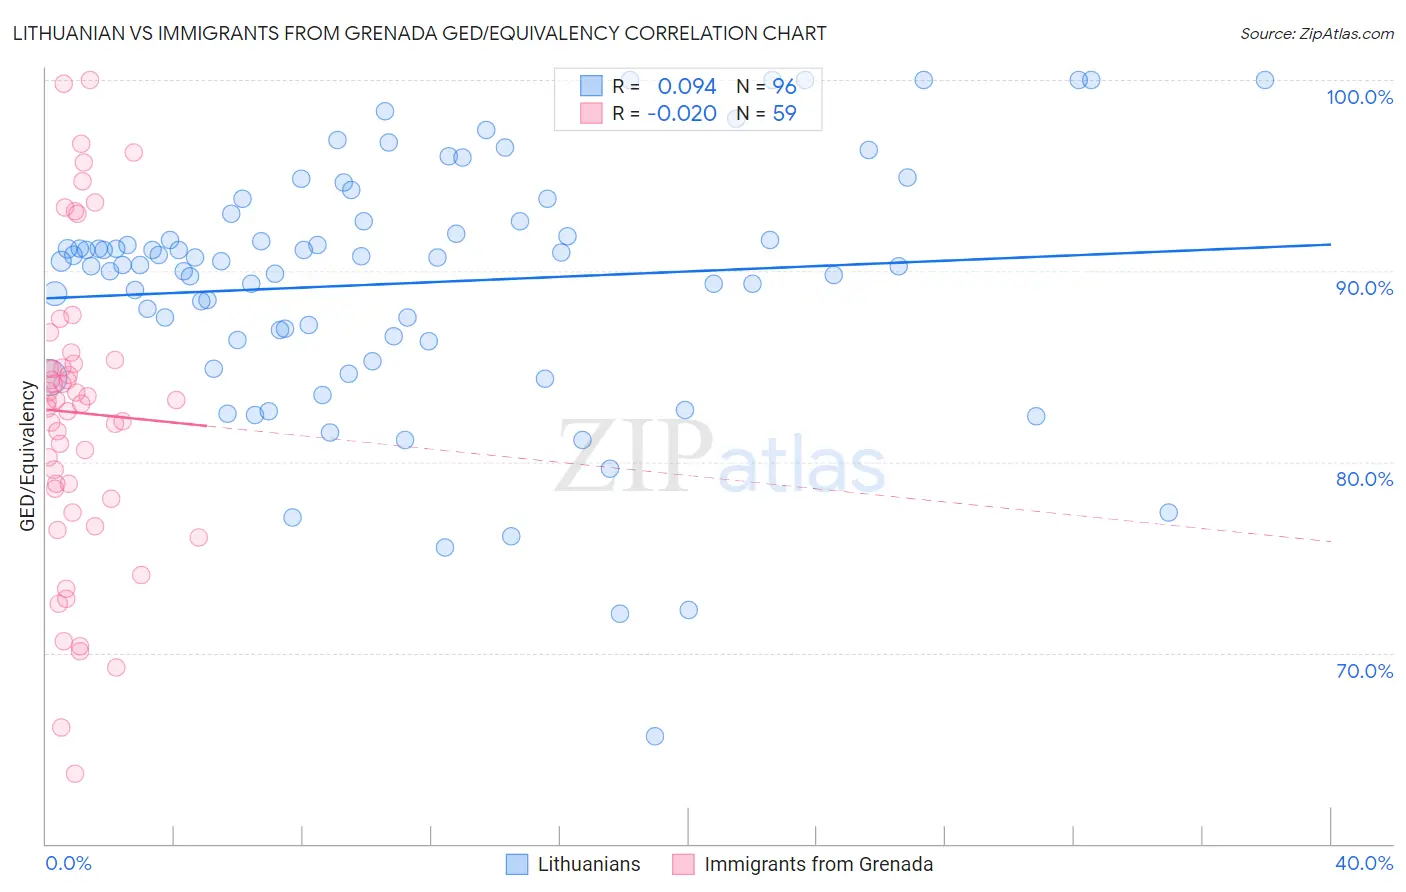
Lithuanian vs Immigrants from Grenada GED/Equivalency Correlation Chart
The statistical analysis conducted on geographies consisting of 421,947,832 people shows a slight positive correlation between the proportion of Lithuanians and percentage of population with at least ged/equivalency education in the United States with a correlation coefficient (R) of 0.094 and weighted average of 88.9%. Similarly, the statistical analysis conducted on geographies consisting of 67,201,908 people shows no correlation between the proportion of Immigrants from Grenada and percentage of population with at least ged/equivalency education in the United States with a correlation coefficient (R) of -0.020 and weighted average of 81.3%, a difference of 9.4%.
GED/Equivalency Correlation Summary
| Measurement | Lithuanian | Immigrants from Grenada |
| Minimum | 65.6% | 63.6% |
| Maximum | 100.0% | 100.0% |
| Range | 34.4% | 36.4% |
| Mean | 89.4% | 82.6% |
| Median | 90.5% | 83.2% |
| Interquartile 25% (IQ1) | 86.5% | 78.1% |
| Interquartile 75% (IQ3) | 92.6% | 85.3% |
| Interquartile Range (IQR) | 6.1% | 7.2% |
| Standard Deviation (Sample) | 6.6% | 8.0% |
| Standard Deviation (Population) | 6.5% | 7.9% |
Similar Demographics by GED/Equivalency
Demographics Similar to Lithuanians by GED/Equivalency
In terms of ged/equivalency, the demographic groups most similar to Lithuanians are Immigrants from Iran (88.9%, a difference of 0.010%), Bulgarian (89.0%, a difference of 0.040%), Cypriot (88.9%, a difference of 0.040%), Okinawan (88.9%, a difference of 0.050%), and Norwegian (89.0%, a difference of 0.080%).
| Demographics | Rating | Rank | GED/Equivalency |
| Latvians | 100.0 /100 | #5 | Exceptional 89.2% |
| Thais | 100.0 /100 | #6 | Exceptional 89.1% |
| Eastern Europeans | 99.9 /100 | #7 | Exceptional 89.1% |
| Carpatho Rusyns | 99.9 /100 | #8 | Exceptional 89.1% |
| Chinese | 99.9 /100 | #9 | Exceptional 89.0% |
| Norwegians | 99.9 /100 | #10 | Exceptional 89.0% |
| Bulgarians | 99.9 /100 | #11 | Exceptional 89.0% |
| Lithuanians | 99.9 /100 | #12 | Exceptional 88.9% |
| Immigrants | Iran | 99.9 /100 | #13 | Exceptional 88.9% |
| Cypriots | 99.9 /100 | #14 | Exceptional 88.9% |
| Okinawans | 99.9 /100 | #15 | Exceptional 88.9% |
| Immigrants | Taiwan | 99.9 /100 | #16 | Exceptional 88.8% |
| Croatians | 99.9 /100 | #17 | Exceptional 88.8% |
| Slovenes | 99.9 /100 | #18 | Exceptional 88.8% |
| Swedes | 99.9 /100 | #19 | Exceptional 88.8% |
Demographics Similar to Immigrants from Grenada by GED/Equivalency
In terms of ged/equivalency, the demographic groups most similar to Immigrants from Grenada are Guyanese (81.3%, a difference of 0.020%), Immigrants from Dominica (81.1%, a difference of 0.19%), Navajo (81.5%, a difference of 0.21%), Puerto Rican (81.1%, a difference of 0.30%), and Immigrants from Haiti (81.6%, a difference of 0.31%).
| Demographics | Rating | Rank | GED/Equivalency |
| Ute | 0.0 /100 | #298 | Tragic 81.8% |
| Ecuadorians | 0.0 /100 | #299 | Tragic 81.7% |
| Fijians | 0.0 /100 | #300 | Tragic 81.6% |
| Dutch West Indians | 0.0 /100 | #301 | Tragic 81.6% |
| Immigrants | Haiti | 0.0 /100 | #302 | Tragic 81.6% |
| Immigrants | Portugal | 0.0 /100 | #303 | Tragic 81.6% |
| Navajo | 0.0 /100 | #304 | Tragic 81.5% |
| Immigrants | Grenada | 0.0 /100 | #305 | Tragic 81.3% |
| Guyanese | 0.0 /100 | #306 | Tragic 81.3% |
| Immigrants | Dominica | 0.0 /100 | #307 | Tragic 81.1% |
| Puerto Ricans | 0.0 /100 | #308 | Tragic 81.1% |
| Immigrants | Ecuador | 0.0 /100 | #309 | Tragic 81.0% |
| Immigrants | Guyana | 0.0 /100 | #310 | Tragic 81.0% |
| Natives/Alaskans | 0.0 /100 | #311 | Tragic 80.9% |
| Nicaraguans | 0.0 /100 | #312 | Tragic 80.9% |