Immigrants from Kazakhstan vs Immigrants from Grenada GED/Equivalency
COMPARE
Immigrants from Kazakhstan
Immigrants from Grenada
GED/Equivalency
GED/Equivalency Comparison
Immigrants from Kazakhstan
Immigrants from Grenada
87.0%
GED/EQUIVALENCY
94.7/ 100
METRIC RATING
114th/ 347
METRIC RANK
81.3%
GED/EQUIVALENCY
0.0/ 100
METRIC RATING
305th/ 347
METRIC RANK
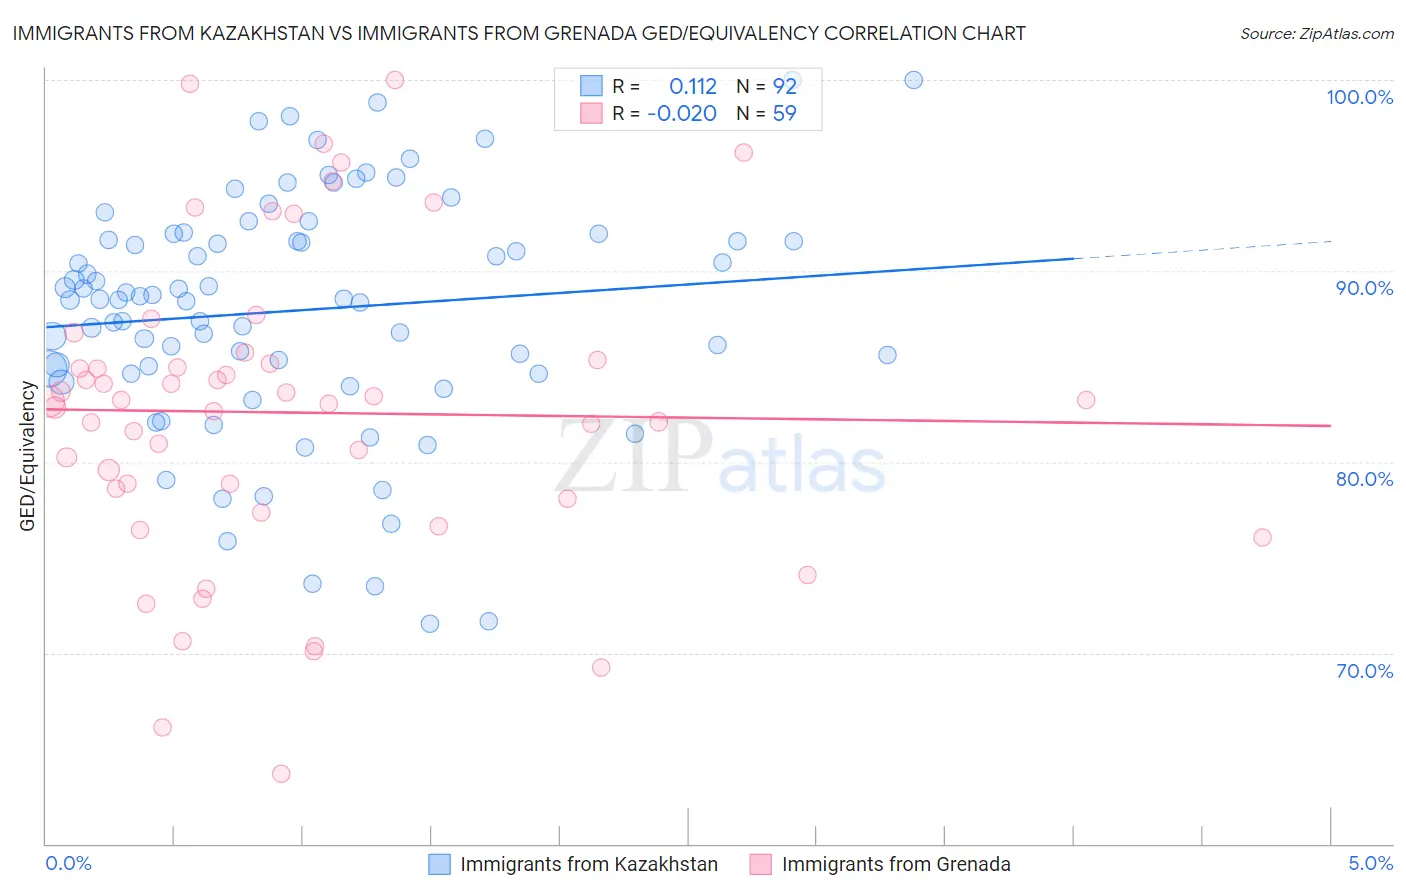
Immigrants from Kazakhstan vs Immigrants from Grenada GED/Equivalency Correlation Chart
The statistical analysis conducted on geographies consisting of 124,444,172 people shows a poor positive correlation between the proportion of Immigrants from Kazakhstan and percentage of population with at least ged/equivalency education in the United States with a correlation coefficient (R) of 0.112 and weighted average of 87.0%. Similarly, the statistical analysis conducted on geographies consisting of 67,201,908 people shows no correlation between the proportion of Immigrants from Grenada and percentage of population with at least ged/equivalency education in the United States with a correlation coefficient (R) of -0.020 and weighted average of 81.3%, a difference of 7.0%.
GED/Equivalency Correlation Summary
| Measurement | Immigrants from Kazakhstan | Immigrants from Grenada |
| Minimum | 71.5% | 63.6% |
| Maximum | 100.0% | 100.0% |
| Range | 28.5% | 36.4% |
| Mean | 87.9% | 82.6% |
| Median | 88.5% | 83.2% |
| Interquartile 25% (IQ1) | 84.8% | 78.1% |
| Interquartile 75% (IQ3) | 91.8% | 85.3% |
| Interquartile Range (IQR) | 7.0% | 7.2% |
| Standard Deviation (Sample) | 6.2% | 8.0% |
| Standard Deviation (Population) | 6.2% | 7.9% |
Similar Demographics by GED/Equivalency
Demographics Similar to Immigrants from Kazakhstan by GED/Equivalency
In terms of ged/equivalency, the demographic groups most similar to Immigrants from Kazakhstan are Tlingit-Haida (87.0%, a difference of 0.010%), Assyrian/Chaldean/Syriac (87.0%, a difference of 0.010%), Mongolian (87.0%, a difference of 0.010%), Swiss (87.0%, a difference of 0.020%), and Egyptian (87.1%, a difference of 0.060%).
| Demographics | Rating | Rank | GED/Equivalency |
| Icelanders | 95.7 /100 | #107 | Exceptional 87.1% |
| Canadians | 95.6 /100 | #108 | Exceptional 87.1% |
| Immigrants | Eastern Europe | 95.5 /100 | #109 | Exceptional 87.1% |
| Egyptians | 95.3 /100 | #110 | Exceptional 87.1% |
| French | 95.2 /100 | #111 | Exceptional 87.1% |
| Tlingit-Haida | 94.8 /100 | #112 | Exceptional 87.0% |
| Assyrians/Chaldeans/Syriacs | 94.8 /100 | #113 | Exceptional 87.0% |
| Immigrants | Kazakhstan | 94.7 /100 | #114 | Exceptional 87.0% |
| Mongolians | 94.6 /100 | #115 | Exceptional 87.0% |
| Swiss | 94.5 /100 | #116 | Exceptional 87.0% |
| Immigrants | Hong Kong | 93.8 /100 | #117 | Exceptional 86.9% |
| French Canadians | 93.2 /100 | #118 | Exceptional 86.9% |
| Immigrants | China | 93.2 /100 | #119 | Exceptional 86.9% |
| Scotch-Irish | 91.6 /100 | #120 | Exceptional 86.8% |
| Immigrants | Lebanon | 90.9 /100 | #121 | Exceptional 86.8% |
Demographics Similar to Immigrants from Grenada by GED/Equivalency
In terms of ged/equivalency, the demographic groups most similar to Immigrants from Grenada are Guyanese (81.3%, a difference of 0.020%), Immigrants from Dominica (81.1%, a difference of 0.19%), Navajo (81.5%, a difference of 0.21%), Puerto Rican (81.1%, a difference of 0.30%), and Immigrants from Haiti (81.6%, a difference of 0.31%).
| Demographics | Rating | Rank | GED/Equivalency |
| Ute | 0.0 /100 | #298 | Tragic 81.8% |
| Ecuadorians | 0.0 /100 | #299 | Tragic 81.7% |
| Fijians | 0.0 /100 | #300 | Tragic 81.6% |
| Dutch West Indians | 0.0 /100 | #301 | Tragic 81.6% |
| Immigrants | Haiti | 0.0 /100 | #302 | Tragic 81.6% |
| Immigrants | Portugal | 0.0 /100 | #303 | Tragic 81.6% |
| Navajo | 0.0 /100 | #304 | Tragic 81.5% |
| Immigrants | Grenada | 0.0 /100 | #305 | Tragic 81.3% |
| Guyanese | 0.0 /100 | #306 | Tragic 81.3% |
| Immigrants | Dominica | 0.0 /100 | #307 | Tragic 81.1% |
| Puerto Ricans | 0.0 /100 | #308 | Tragic 81.1% |
| Immigrants | Ecuador | 0.0 /100 | #309 | Tragic 81.0% |
| Immigrants | Guyana | 0.0 /100 | #310 | Tragic 81.0% |
| Natives/Alaskans | 0.0 /100 | #311 | Tragic 80.9% |
| Nicaraguans | 0.0 /100 | #312 | Tragic 80.9% |