Lithuanian vs Immigrants from Grenada College, Under 1 year
COMPARE
Lithuanian
Immigrants from Grenada
College, Under 1 year
College, Under 1 year Comparison
Lithuanians
Immigrants from Grenada
68.8%
COLLEGE, UNDER 1 YEAR
99.1/ 100
METRIC RATING
70th/ 347
METRIC RANK
59.1%
COLLEGE, UNDER 1 YEAR
0.0/ 100
METRIC RATING
295th/ 347
METRIC RANK
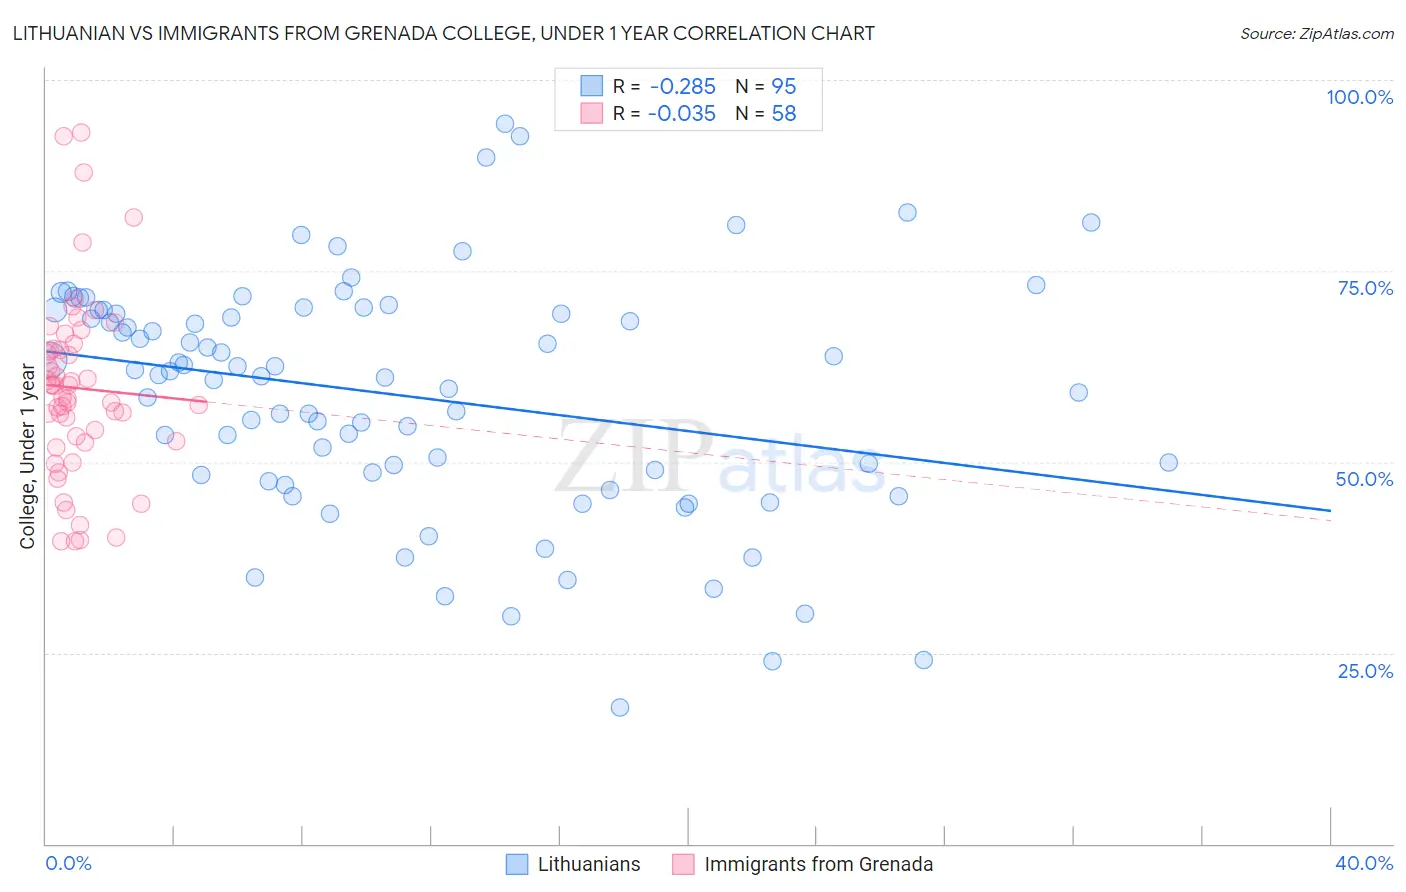
Lithuanian vs Immigrants from Grenada College, Under 1 year Correlation Chart
The statistical analysis conducted on geographies consisting of 421,945,677 people shows a weak negative correlation between the proportion of Lithuanians and percentage of population with at least college, under 1 year education in the United States with a correlation coefficient (R) of -0.285 and weighted average of 68.8%. Similarly, the statistical analysis conducted on geographies consisting of 67,201,096 people shows no correlation between the proportion of Immigrants from Grenada and percentage of population with at least college, under 1 year education in the United States with a correlation coefficient (R) of -0.035 and weighted average of 59.1%, a difference of 16.4%.
College, Under 1 year Correlation Summary
| Measurement | Lithuanian | Immigrants from Grenada |
| Minimum | 17.9% | 39.6% |
| Maximum | 94.2% | 93.2% |
| Range | 76.4% | 53.6% |
| Mean | 58.7% | 59.7% |
| Median | 61.4% | 59.3% |
| Interquartile 25% (IQ1) | 48.2% | 52.6% |
| Interquartile 75% (IQ3) | 69.9% | 64.8% |
| Interquartile Range (IQR) | 21.6% | 12.2% |
| Standard Deviation (Sample) | 15.4% | 11.9% |
| Standard Deviation (Population) | 15.4% | 11.8% |
Similar Demographics by College, Under 1 year
Demographics Similar to Lithuanians by College, Under 1 year
In terms of college, under 1 year, the demographic groups most similar to Lithuanians are Immigrants from Europe (68.8%, a difference of 0.010%), Bolivian (68.7%, a difference of 0.060%), Immigrants from England (68.7%, a difference of 0.090%), Swedish (68.7%, a difference of 0.15%), and Immigrants from Romania (68.9%, a difference of 0.16%).
| Demographics | Rating | Rank | College, Under 1 year |
| Immigrants | Canada | 99.4 /100 | #63 | Exceptional 69.1% |
| Northern Europeans | 99.4 /100 | #64 | Exceptional 69.0% |
| Immigrants | Moldova | 99.3 /100 | #65 | Exceptional 69.0% |
| Immigrants | North America | 99.3 /100 | #66 | Exceptional 69.0% |
| Immigrants | Zimbabwe | 99.2 /100 | #67 | Exceptional 68.9% |
| Immigrants | Indonesia | 99.2 /100 | #68 | Exceptional 68.9% |
| Immigrants | Romania | 99.2 /100 | #69 | Exceptional 68.9% |
| Lithuanians | 99.1 /100 | #70 | Exceptional 68.8% |
| Immigrants | Europe | 99.1 /100 | #71 | Exceptional 68.8% |
| Bolivians | 99.0 /100 | #72 | Exceptional 68.7% |
| Immigrants | England | 99.0 /100 | #73 | Exceptional 68.7% |
| Swedes | 98.9 /100 | #74 | Exceptional 68.7% |
| Immigrants | Western Europe | 98.6 /100 | #75 | Exceptional 68.5% |
| Laotians | 98.6 /100 | #76 | Exceptional 68.5% |
| British | 98.6 /100 | #77 | Exceptional 68.5% |
Demographics Similar to Immigrants from Grenada by College, Under 1 year
In terms of college, under 1 year, the demographic groups most similar to Immigrants from Grenada are Central American Indian (59.0%, a difference of 0.040%), Guyanese (59.0%, a difference of 0.080%), Immigrants from Belize (59.1%, a difference of 0.10%), Seminole (59.1%, a difference of 0.12%), and Nicaraguan (59.2%, a difference of 0.31%).
| Demographics | Rating | Rank | College, Under 1 year |
| Blacks/African Americans | 0.0 /100 | #288 | Tragic 59.4% |
| Choctaw | 0.0 /100 | #289 | Tragic 59.3% |
| Ecuadorians | 0.0 /100 | #290 | Tragic 59.3% |
| Creek | 0.0 /100 | #291 | Tragic 59.3% |
| Nicaraguans | 0.0 /100 | #292 | Tragic 59.2% |
| Seminole | 0.0 /100 | #293 | Tragic 59.1% |
| Immigrants | Belize | 0.0 /100 | #294 | Tragic 59.1% |
| Immigrants | Grenada | 0.0 /100 | #295 | Tragic 59.1% |
| Central American Indians | 0.0 /100 | #296 | Tragic 59.0% |
| Guyanese | 0.0 /100 | #297 | Tragic 59.0% |
| Immigrants | Ecuador | 0.0 /100 | #298 | Tragic 58.7% |
| Cubans | 0.0 /100 | #299 | Tragic 58.6% |
| Immigrants | Guyana | 0.0 /100 | #300 | Tragic 58.5% |
| Mexican American Indians | 0.0 /100 | #301 | Tragic 58.1% |
| Apache | 0.0 /100 | #302 | Tragic 58.0% |