Barbadian vs Immigrants from Grenada GED/Equivalency
COMPARE
Barbadian
Immigrants from Grenada
GED/Equivalency
GED/Equivalency Comparison
Barbadians
Immigrants from Grenada
82.9%
GED/EQUIVALENCY
0.1/ 100
METRIC RATING
272nd/ 347
METRIC RANK
81.3%
GED/EQUIVALENCY
0.0/ 100
METRIC RATING
305th/ 347
METRIC RANK
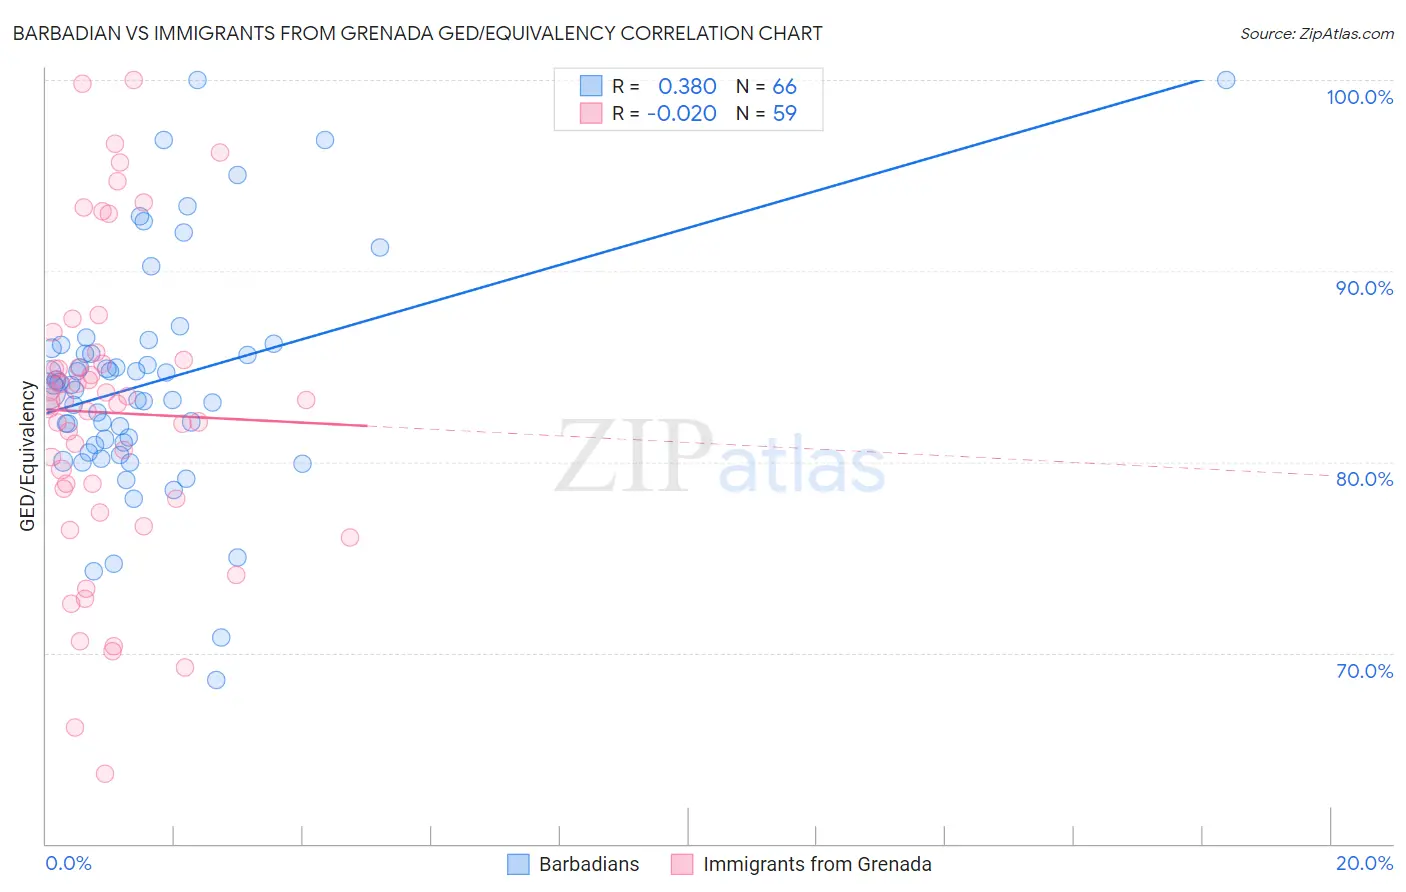
Barbadian vs Immigrants from Grenada GED/Equivalency Correlation Chart
The statistical analysis conducted on geographies consisting of 141,302,824 people shows a mild positive correlation between the proportion of Barbadians and percentage of population with at least ged/equivalency education in the United States with a correlation coefficient (R) of 0.380 and weighted average of 82.9%. Similarly, the statistical analysis conducted on geographies consisting of 67,201,908 people shows no correlation between the proportion of Immigrants from Grenada and percentage of population with at least ged/equivalency education in the United States with a correlation coefficient (R) of -0.020 and weighted average of 81.3%, a difference of 1.9%.
GED/Equivalency Correlation Summary
| Measurement | Barbadian | Immigrants from Grenada |
| Minimum | 68.6% | 63.6% |
| Maximum | 100.0% | 100.0% |
| Range | 31.4% | 36.4% |
| Mean | 84.2% | 82.6% |
| Median | 83.9% | 83.2% |
| Interquartile 25% (IQ1) | 80.9% | 78.1% |
| Interquartile 75% (IQ3) | 85.9% | 85.3% |
| Interquartile Range (IQR) | 5.0% | 7.2% |
| Standard Deviation (Sample) | 6.0% | 8.0% |
| Standard Deviation (Population) | 6.0% | 7.9% |
Similar Demographics by GED/Equivalency
Demographics Similar to Barbadians by GED/Equivalency
In terms of ged/equivalency, the demographic groups most similar to Barbadians are Pennsylvania German (82.9%, a difference of 0.010%), Immigrants from Trinidad and Tobago (82.8%, a difference of 0.020%), U.S. Virgin Islander (82.9%, a difference of 0.040%), Immigrants from Jamaica (82.9%, a difference of 0.080%), and Seminole (82.8%, a difference of 0.090%).
| Demographics | Rating | Rank | GED/Equivalency |
| West Indians | 0.2 /100 | #265 | Tragic 83.1% |
| Kiowa | 0.2 /100 | #266 | Tragic 83.1% |
| Trinidadians and Tobagonians | 0.2 /100 | #267 | Tragic 83.0% |
| Immigrants | Burma/Myanmar | 0.2 /100 | #268 | Tragic 83.0% |
| Hopi | 0.2 /100 | #269 | Tragic 83.0% |
| Immigrants | Jamaica | 0.2 /100 | #270 | Tragic 82.9% |
| U.S. Virgin Islanders | 0.2 /100 | #271 | Tragic 82.9% |
| Barbadians | 0.1 /100 | #272 | Tragic 82.9% |
| Pennsylvania Germans | 0.1 /100 | #273 | Tragic 82.9% |
| Immigrants | Trinidad and Tobago | 0.1 /100 | #274 | Tragic 82.8% |
| Seminole | 0.1 /100 | #275 | Tragic 82.8% |
| Blacks/African Americans | 0.1 /100 | #276 | Tragic 82.8% |
| Arapaho | 0.1 /100 | #277 | Tragic 82.8% |
| Immigrants | Laos | 0.1 /100 | #278 | Tragic 82.7% |
| Immigrants | Fiji | 0.1 /100 | #279 | Tragic 82.7% |
Demographics Similar to Immigrants from Grenada by GED/Equivalency
In terms of ged/equivalency, the demographic groups most similar to Immigrants from Grenada are Guyanese (81.3%, a difference of 0.020%), Immigrants from Dominica (81.1%, a difference of 0.19%), Navajo (81.5%, a difference of 0.21%), Puerto Rican (81.1%, a difference of 0.30%), and Immigrants from Haiti (81.6%, a difference of 0.31%).
| Demographics | Rating | Rank | GED/Equivalency |
| Ute | 0.0 /100 | #298 | Tragic 81.8% |
| Ecuadorians | 0.0 /100 | #299 | Tragic 81.7% |
| Fijians | 0.0 /100 | #300 | Tragic 81.6% |
| Dutch West Indians | 0.0 /100 | #301 | Tragic 81.6% |
| Immigrants | Haiti | 0.0 /100 | #302 | Tragic 81.6% |
| Immigrants | Portugal | 0.0 /100 | #303 | Tragic 81.6% |
| Navajo | 0.0 /100 | #304 | Tragic 81.5% |
| Immigrants | Grenada | 0.0 /100 | #305 | Tragic 81.3% |
| Guyanese | 0.0 /100 | #306 | Tragic 81.3% |
| Immigrants | Dominica | 0.0 /100 | #307 | Tragic 81.1% |
| Puerto Ricans | 0.0 /100 | #308 | Tragic 81.1% |
| Immigrants | Ecuador | 0.0 /100 | #309 | Tragic 81.0% |
| Immigrants | Guyana | 0.0 /100 | #310 | Tragic 81.0% |
| Natives/Alaskans | 0.0 /100 | #311 | Tragic 80.9% |
| Nicaraguans | 0.0 /100 | #312 | Tragic 80.9% |