Lithuanian vs Basque GED/Equivalency
COMPARE
Lithuanian
Basque
GED/Equivalency
GED/Equivalency Comparison
Lithuanians
Basques
88.9%
GED/EQUIVALENCY
99.9/ 100
METRIC RATING
12th/ 347
METRIC RANK
86.4%
GED/EQUIVALENCY
79.5/ 100
METRIC RATING
146th/ 347
METRIC RANK
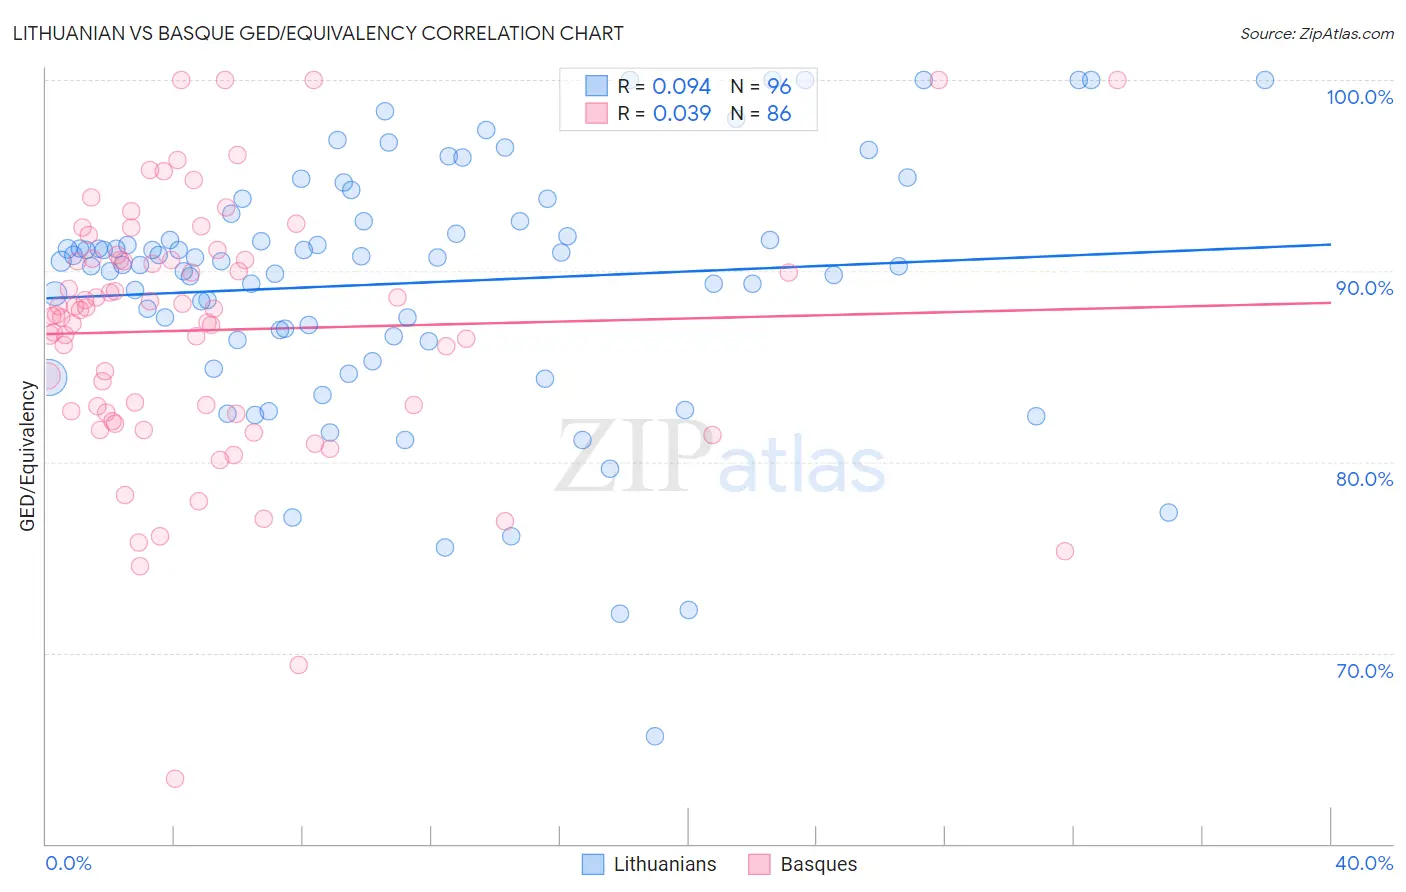
Lithuanian vs Basque GED/Equivalency Correlation Chart
The statistical analysis conducted on geographies consisting of 421,947,832 people shows a slight positive correlation between the proportion of Lithuanians and percentage of population with at least ged/equivalency education in the United States with a correlation coefficient (R) of 0.094 and weighted average of 88.9%. Similarly, the statistical analysis conducted on geographies consisting of 165,778,463 people shows no correlation between the proportion of Basques and percentage of population with at least ged/equivalency education in the United States with a correlation coefficient (R) of 0.039 and weighted average of 86.4%, a difference of 3.0%.
GED/Equivalency Correlation Summary
| Measurement | Lithuanian | Basque |
| Minimum | 65.6% | 63.4% |
| Maximum | 100.0% | 100.0% |
| Range | 34.4% | 36.6% |
| Mean | 89.4% | 86.9% |
| Median | 90.5% | 87.8% |
| Interquartile 25% (IQ1) | 86.5% | 82.6% |
| Interquartile 75% (IQ3) | 92.6% | 90.6% |
| Interquartile Range (IQR) | 6.1% | 8.0% |
| Standard Deviation (Sample) | 6.6% | 6.8% |
| Standard Deviation (Population) | 6.5% | 6.7% |
Similar Demographics by GED/Equivalency
Demographics Similar to Lithuanians by GED/Equivalency
In terms of ged/equivalency, the demographic groups most similar to Lithuanians are Immigrants from Iran (88.9%, a difference of 0.010%), Bulgarian (89.0%, a difference of 0.040%), Cypriot (88.9%, a difference of 0.040%), Okinawan (88.9%, a difference of 0.050%), and Norwegian (89.0%, a difference of 0.080%).
| Demographics | Rating | Rank | GED/Equivalency |
| Latvians | 100.0 /100 | #5 | Exceptional 89.2% |
| Thais | 100.0 /100 | #6 | Exceptional 89.1% |
| Eastern Europeans | 99.9 /100 | #7 | Exceptional 89.1% |
| Carpatho Rusyns | 99.9 /100 | #8 | Exceptional 89.1% |
| Chinese | 99.9 /100 | #9 | Exceptional 89.0% |
| Norwegians | 99.9 /100 | #10 | Exceptional 89.0% |
| Bulgarians | 99.9 /100 | #11 | Exceptional 89.0% |
| Lithuanians | 99.9 /100 | #12 | Exceptional 88.9% |
| Immigrants | Iran | 99.9 /100 | #13 | Exceptional 88.9% |
| Cypriots | 99.9 /100 | #14 | Exceptional 88.9% |
| Okinawans | 99.9 /100 | #15 | Exceptional 88.9% |
| Immigrants | Taiwan | 99.9 /100 | #16 | Exceptional 88.8% |
| Croatians | 99.9 /100 | #17 | Exceptional 88.8% |
| Slovenes | 99.9 /100 | #18 | Exceptional 88.8% |
| Swedes | 99.9 /100 | #19 | Exceptional 88.8% |
Demographics Similar to Basques by GED/Equivalency
In terms of ged/equivalency, the demographic groups most similar to Basques are Immigrants from Northern Africa (86.3%, a difference of 0.0%), Immigrants from Poland (86.3%, a difference of 0.0%), Menominee (86.3%, a difference of 0.010%), Immigrants from Western Asia (86.3%, a difference of 0.020%), and Pakistani (86.4%, a difference of 0.030%).
| Demographics | Rating | Rank | GED/Equivalency |
| Immigrants | Malaysia | 85.0 /100 | #139 | Excellent 86.5% |
| Paraguayans | 84.1 /100 | #140 | Excellent 86.5% |
| Laotians | 83.2 /100 | #141 | Excellent 86.5% |
| Immigrants | Indonesia | 82.4 /100 | #142 | Excellent 86.4% |
| Immigrants | Pakistan | 82.4 /100 | #143 | Excellent 86.4% |
| Bolivians | 82.1 /100 | #144 | Excellent 86.4% |
| Pakistanis | 80.4 /100 | #145 | Excellent 86.4% |
| Basques | 79.5 /100 | #146 | Good 86.4% |
| Immigrants | Northern Africa | 79.3 /100 | #147 | Good 86.3% |
| Immigrants | Poland | 79.3 /100 | #148 | Good 86.3% |
| Menominee | 79.3 /100 | #149 | Good 86.3% |
| Immigrants | Western Asia | 78.8 /100 | #150 | Good 86.3% |
| Immigrants | Bosnia and Herzegovina | 77.9 /100 | #151 | Good 86.3% |
| Brazilians | 77.2 /100 | #152 | Good 86.3% |
| Kenyans | 76.6 /100 | #153 | Good 86.3% |