Turkish vs Immigrants from Grenada GED/Equivalency
COMPARE
Turkish
Immigrants from Grenada
GED/Equivalency
GED/Equivalency Comparison
Turks
Immigrants from Grenada
88.5%
GED/EQUIVALENCY
99.8/ 100
METRIC RATING
30th/ 347
METRIC RANK
81.3%
GED/EQUIVALENCY
0.0/ 100
METRIC RATING
305th/ 347
METRIC RANK
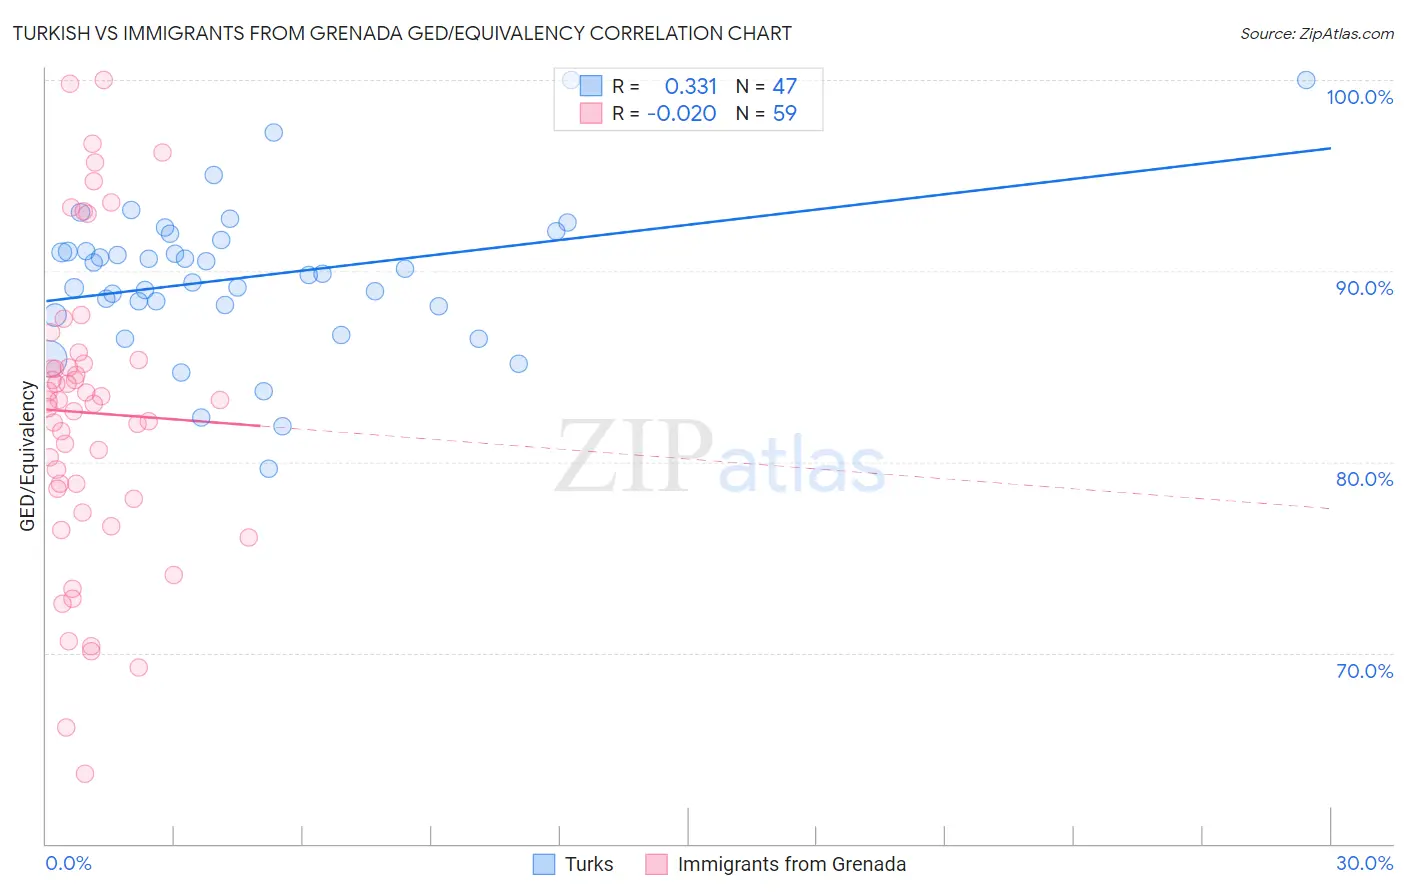
Turkish vs Immigrants from Grenada GED/Equivalency Correlation Chart
The statistical analysis conducted on geographies consisting of 271,864,133 people shows a mild positive correlation between the proportion of Turks and percentage of population with at least ged/equivalency education in the United States with a correlation coefficient (R) of 0.331 and weighted average of 88.5%. Similarly, the statistical analysis conducted on geographies consisting of 67,201,908 people shows no correlation between the proportion of Immigrants from Grenada and percentage of population with at least ged/equivalency education in the United States with a correlation coefficient (R) of -0.020 and weighted average of 81.3%, a difference of 8.8%.
GED/Equivalency Correlation Summary
| Measurement | Turkish | Immigrants from Grenada |
| Minimum | 79.7% | 63.6% |
| Maximum | 100.0% | 100.0% |
| Range | 20.3% | 36.4% |
| Mean | 89.7% | 82.6% |
| Median | 89.9% | 83.2% |
| Interquartile 25% (IQ1) | 88.1% | 78.1% |
| Interquartile 75% (IQ3) | 91.7% | 85.3% |
| Interquartile Range (IQR) | 3.5% | 7.2% |
| Standard Deviation (Sample) | 4.0% | 8.0% |
| Standard Deviation (Population) | 4.0% | 7.9% |
Similar Demographics by GED/Equivalency
Demographics Similar to Turks by GED/Equivalency
In terms of ged/equivalency, the demographic groups most similar to Turks are Polish (88.5%, a difference of 0.020%), Bhutanese (88.4%, a difference of 0.030%), Immigrants from Northern Europe (88.5%, a difference of 0.050%), Danish (88.4%, a difference of 0.050%), and Immigrants from Lithuania (88.6%, a difference of 0.090%).
| Demographics | Rating | Rank | GED/Equivalency |
| Russians | 99.8 /100 | #23 | Exceptional 88.6% |
| Slovaks | 99.8 /100 | #24 | Exceptional 88.6% |
| Estonians | 99.8 /100 | #25 | Exceptional 88.6% |
| Immigrants | Australia | 99.8 /100 | #26 | Exceptional 88.6% |
| Immigrants | Lithuania | 99.8 /100 | #27 | Exceptional 88.6% |
| Immigrants | Northern Europe | 99.8 /100 | #28 | Exceptional 88.5% |
| Poles | 99.8 /100 | #29 | Exceptional 88.5% |
| Turks | 99.8 /100 | #30 | Exceptional 88.5% |
| Bhutanese | 99.8 /100 | #31 | Exceptional 88.4% |
| Danes | 99.8 /100 | #32 | Exceptional 88.4% |
| Immigrants | Sweden | 99.7 /100 | #33 | Exceptional 88.4% |
| Immigrants | Japan | 99.7 /100 | #34 | Exceptional 88.4% |
| Immigrants | South Central Asia | 99.7 /100 | #35 | Exceptional 88.4% |
| Immigrants | Belgium | 99.7 /100 | #36 | Exceptional 88.3% |
| Immigrants | Austria | 99.7 /100 | #37 | Exceptional 88.3% |
Demographics Similar to Immigrants from Grenada by GED/Equivalency
In terms of ged/equivalency, the demographic groups most similar to Immigrants from Grenada are Guyanese (81.3%, a difference of 0.020%), Immigrants from Dominica (81.1%, a difference of 0.19%), Navajo (81.5%, a difference of 0.21%), Puerto Rican (81.1%, a difference of 0.30%), and Immigrants from Haiti (81.6%, a difference of 0.31%).
| Demographics | Rating | Rank | GED/Equivalency |
| Ute | 0.0 /100 | #298 | Tragic 81.8% |
| Ecuadorians | 0.0 /100 | #299 | Tragic 81.7% |
| Fijians | 0.0 /100 | #300 | Tragic 81.6% |
| Dutch West Indians | 0.0 /100 | #301 | Tragic 81.6% |
| Immigrants | Haiti | 0.0 /100 | #302 | Tragic 81.6% |
| Immigrants | Portugal | 0.0 /100 | #303 | Tragic 81.6% |
| Navajo | 0.0 /100 | #304 | Tragic 81.5% |
| Immigrants | Grenada | 0.0 /100 | #305 | Tragic 81.3% |
| Guyanese | 0.0 /100 | #306 | Tragic 81.3% |
| Immigrants | Dominica | 0.0 /100 | #307 | Tragic 81.1% |
| Puerto Ricans | 0.0 /100 | #308 | Tragic 81.1% |
| Immigrants | Ecuador | 0.0 /100 | #309 | Tragic 81.0% |
| Immigrants | Guyana | 0.0 /100 | #310 | Tragic 81.0% |
| Natives/Alaskans | 0.0 /100 | #311 | Tragic 80.9% |
| Nicaraguans | 0.0 /100 | #312 | Tragic 80.9% |