Lithuanian vs Dominican Per Capita Income
COMPARE
Lithuanian
Dominican
Per Capita Income
Per Capita Income Comparison
Lithuanians
Dominicans
$49,448
PER CAPITA INCOME
99.8/ 100
METRIC RATING
68th/ 347
METRIC RANK
$37,697
PER CAPITA INCOME
0.1/ 100
METRIC RATING
287th/ 347
METRIC RANK
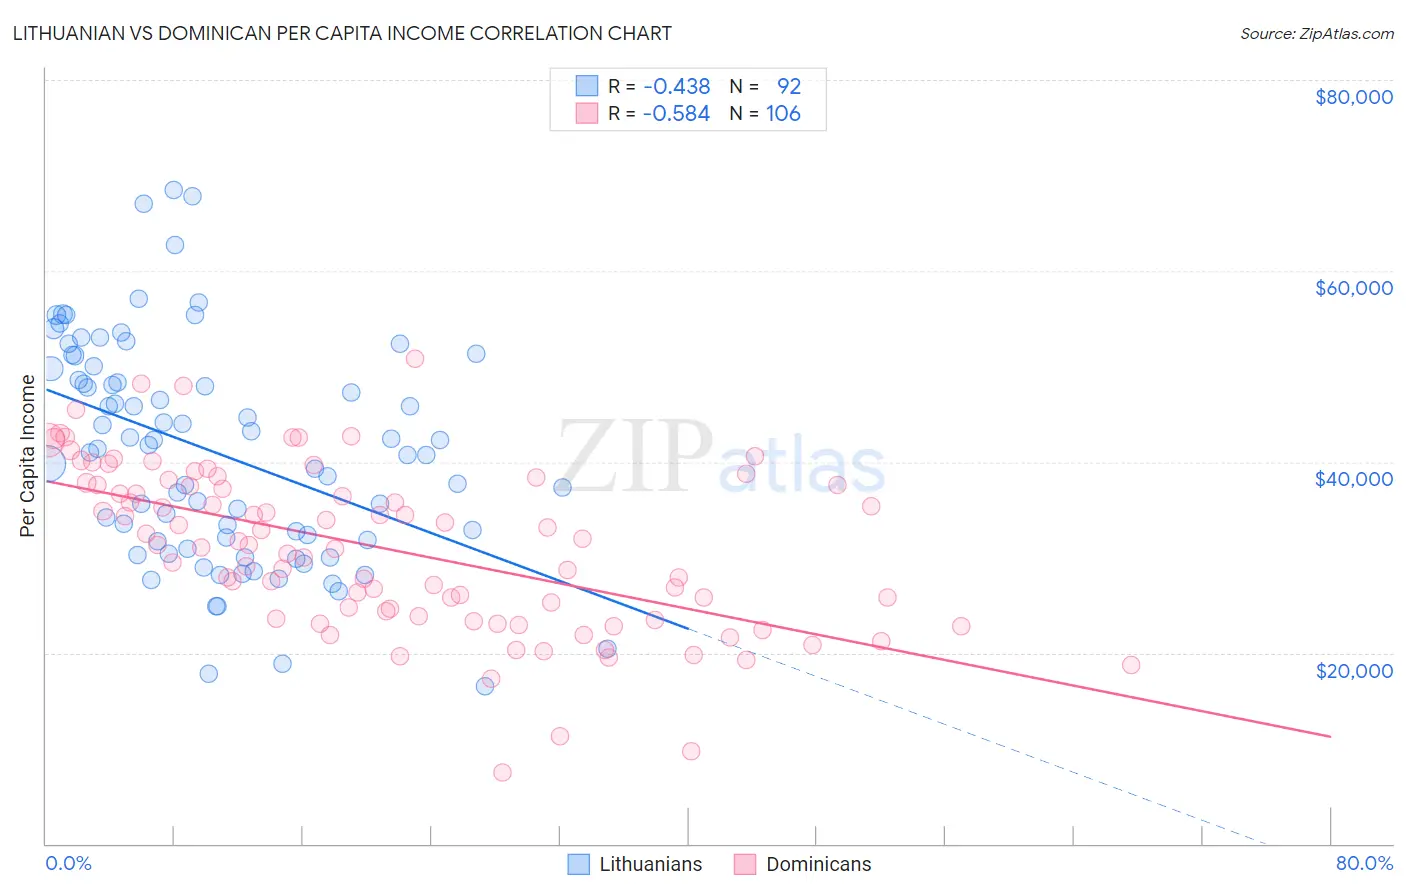
Lithuanian vs Dominican Per Capita Income Correlation Chart
The statistical analysis conducted on geographies consisting of 421,963,914 people shows a moderate negative correlation between the proportion of Lithuanians and per capita income in the United States with a correlation coefficient (R) of -0.438 and weighted average of $49,448. Similarly, the statistical analysis conducted on geographies consisting of 355,170,092 people shows a substantial negative correlation between the proportion of Dominicans and per capita income in the United States with a correlation coefficient (R) of -0.584 and weighted average of $37,697, a difference of 31.2%.
Per Capita Income Correlation Summary
| Measurement | Lithuanian | Dominican |
| Minimum | $16,487 | $7,474 |
| Maximum | $68,542 | $50,766 |
| Range | $52,055 | $43,292 |
| Mean | $40,931 | $30,940 |
| Median | $41,220 | $31,292 |
| Interquartile 25% (IQ1) | $31,717 | $23,892 |
| Interquartile 75% (IQ3) | $49,156 | $37,544 |
| Interquartile Range (IQR) | $17,439 | $13,652 |
| Standard Deviation (Sample) | $11,469 | $8,599 |
| Standard Deviation (Population) | $11,406 | $8,559 |
Similar Demographics by Per Capita Income
Demographics Similar to Lithuanians by Per Capita Income
In terms of per capita income, the demographic groups most similar to Lithuanians are Immigrants from Romania ($49,463, a difference of 0.030%), Immigrants from Bulgaria ($49,482, a difference of 0.070%), Immigrants from Canada ($49,412, a difference of 0.070%), Bolivian ($49,526, a difference of 0.16%), and Immigrants from Eastern Europe ($49,316, a difference of 0.27%).
| Demographics | Rating | Rank | Per Capita Income |
| Argentineans | 99.9 /100 | #61 | Exceptional $49,862 |
| Immigrants | Asia | 99.9 /100 | #62 | Exceptional $49,741 |
| Maltese | 99.9 /100 | #63 | Exceptional $49,640 |
| Immigrants | Argentina | 99.9 /100 | #64 | Exceptional $49,627 |
| Bolivians | 99.9 /100 | #65 | Exceptional $49,526 |
| Immigrants | Bulgaria | 99.9 /100 | #66 | Exceptional $49,482 |
| Immigrants | Romania | 99.9 /100 | #67 | Exceptional $49,463 |
| Lithuanians | 99.8 /100 | #68 | Exceptional $49,448 |
| Immigrants | Canada | 99.8 /100 | #69 | Exceptional $49,412 |
| Immigrants | Eastern Europe | 99.8 /100 | #70 | Exceptional $49,316 |
| Greeks | 99.8 /100 | #71 | Exceptional $49,309 |
| Immigrants | Hungary | 99.8 /100 | #72 | Exceptional $49,303 |
| Immigrants | North America | 99.8 /100 | #73 | Exceptional $49,302 |
| Mongolians | 99.8 /100 | #74 | Exceptional $49,173 |
| Immigrants | Bolivia | 99.7 /100 | #75 | Exceptional $48,970 |
Demographics Similar to Dominicans by Per Capita Income
In terms of per capita income, the demographic groups most similar to Dominicans are Blackfeet ($37,695, a difference of 0.0%), Central American Indian ($37,699, a difference of 0.010%), Guatemalan ($37,766, a difference of 0.19%), African ($37,785, a difference of 0.24%), and U.S. Virgin Islander ($37,589, a difference of 0.29%).
| Demographics | Rating | Rank | Per Capita Income |
| Potawatomi | 0.2 /100 | #280 | Tragic $38,046 |
| Immigrants | Dominica | 0.2 /100 | #281 | Tragic $37,952 |
| Immigrants | Laos | 0.1 /100 | #282 | Tragic $37,857 |
| Pennsylvania Germans | 0.1 /100 | #283 | Tragic $37,842 |
| Africans | 0.1 /100 | #284 | Tragic $37,785 |
| Guatemalans | 0.1 /100 | #285 | Tragic $37,766 |
| Central American Indians | 0.1 /100 | #286 | Tragic $37,699 |
| Dominicans | 0.1 /100 | #287 | Tragic $37,697 |
| Blackfeet | 0.1 /100 | #288 | Tragic $37,695 |
| U.S. Virgin Islanders | 0.1 /100 | #289 | Tragic $37,589 |
| Immigrants | Guatemala | 0.1 /100 | #290 | Tragic $37,550 |
| Cajuns | 0.1 /100 | #291 | Tragic $37,527 |
| Immigrants | Micronesia | 0.1 /100 | #292 | Tragic $37,464 |
| Mexican American Indians | 0.1 /100 | #293 | Tragic $37,407 |
| Cubans | 0.1 /100 | #294 | Tragic $37,383 |