Liberian vs Ethiopian Associate's Degree
COMPARE
Liberian
Ethiopian
Associate's Degree
Associate's Degree Comparison
Liberians
Ethiopians
43.3%
ASSOCIATE'S DEGREE
2.9/ 100
METRIC RATING
231st/ 347
METRIC RANK
50.4%
ASSOCIATE'S DEGREE
99.1/ 100
METRIC RATING
79th/ 347
METRIC RANK
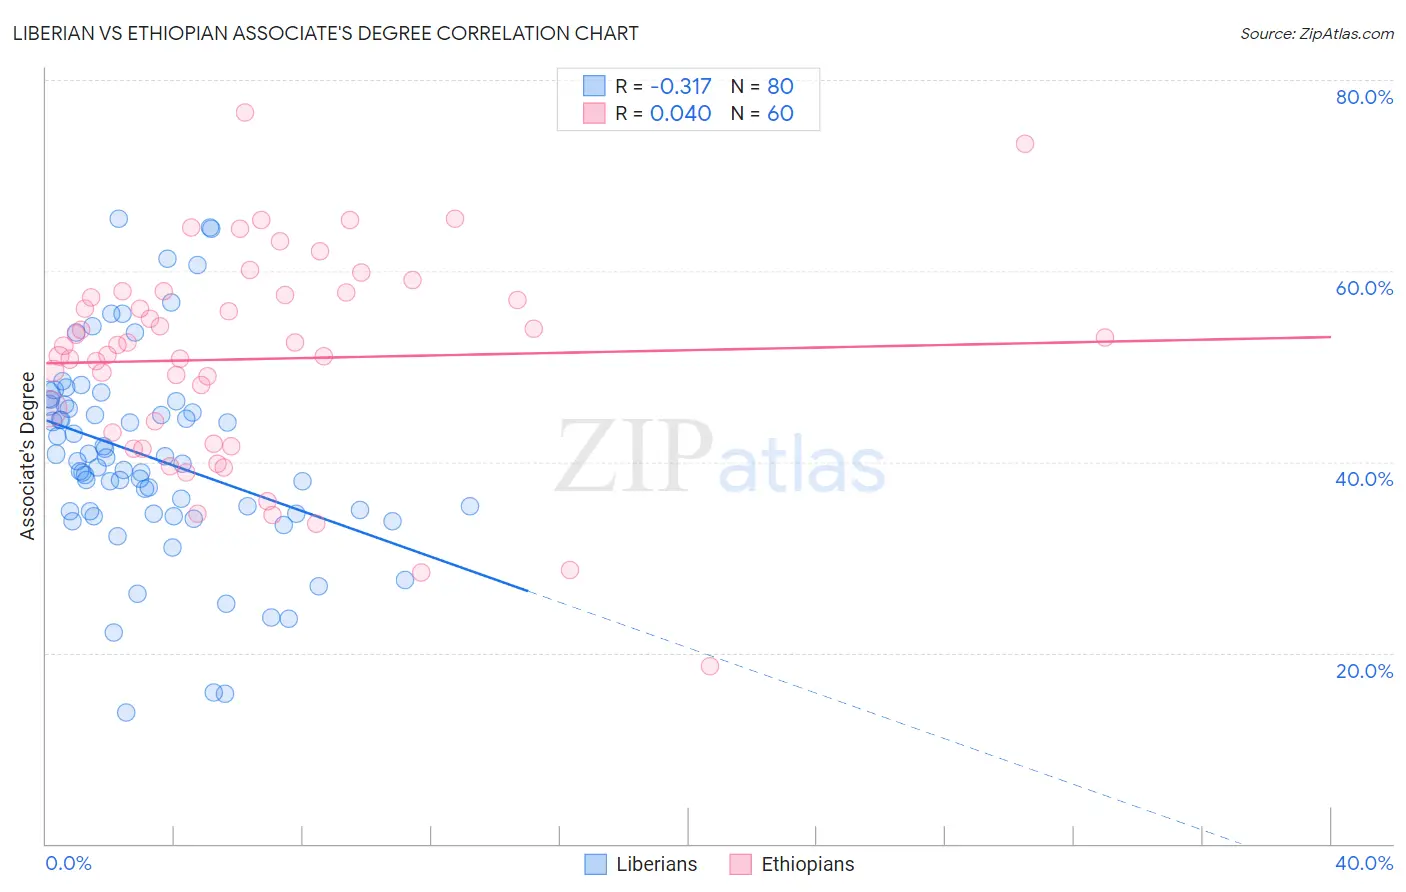
Liberian vs Ethiopian Associate's Degree Correlation Chart
The statistical analysis conducted on geographies consisting of 118,102,624 people shows a mild negative correlation between the proportion of Liberians and percentage of population with at least associate's degree education in the United States with a correlation coefficient (R) of -0.317 and weighted average of 43.3%. Similarly, the statistical analysis conducted on geographies consisting of 223,259,495 people shows no correlation between the proportion of Ethiopians and percentage of population with at least associate's degree education in the United States with a correlation coefficient (R) of 0.040 and weighted average of 50.4%, a difference of 16.5%.
Associate's Degree Correlation Summary
| Measurement | Liberian | Ethiopian |
| Minimum | 13.8% | 18.6% |
| Maximum | 65.5% | 76.6% |
| Range | 51.7% | 58.0% |
| Mean | 40.5% | 50.8% |
| Median | 39.9% | 52.2% |
| Interquartile 25% (IQ1) | 34.7% | 42.5% |
| Interquartile 75% (IQ3) | 45.9% | 57.6% |
| Interquartile Range (IQR) | 11.3% | 15.1% |
| Standard Deviation (Sample) | 10.6% | 11.1% |
| Standard Deviation (Population) | 10.5% | 11.0% |
Similar Demographics by Associate's Degree
Demographics Similar to Liberians by Associate's Degree
In terms of associate's degree, the demographic groups most similar to Liberians are Immigrants from Barbados (43.3%, a difference of 0.010%), Immigrants from Trinidad and Tobago (43.3%, a difference of 0.080%), Hmong (43.4%, a difference of 0.23%), Native Hawaiian (43.1%, a difference of 0.43%), and Tongan (43.0%, a difference of 0.59%).
| Demographics | Rating | Rank | Associate's Degree |
| West Indians | 5.2 /100 | #224 | Tragic 43.8% |
| Guamanians/Chamorros | 4.8 /100 | #225 | Tragic 43.8% |
| Immigrants | Burma/Myanmar | 4.3 /100 | #226 | Tragic 43.7% |
| Trinidadians and Tobagonians | 4.0 /100 | #227 | Tragic 43.6% |
| Hmong | 3.2 /100 | #228 | Tragic 43.4% |
| Immigrants | Trinidad and Tobago | 3.0 /100 | #229 | Tragic 43.3% |
| Immigrants | Barbados | 2.9 /100 | #230 | Tragic 43.3% |
| Liberians | 2.9 /100 | #231 | Tragic 43.3% |
| Native Hawaiians | 2.3 /100 | #232 | Tragic 43.1% |
| Tongans | 2.2 /100 | #233 | Tragic 43.0% |
| Tlingit-Haida | 2.1 /100 | #234 | Tragic 43.0% |
| Ecuadorians | 2.0 /100 | #235 | Tragic 43.0% |
| Immigrants | St. Vincent and the Grenadines | 1.9 /100 | #236 | Tragic 42.9% |
| Immigrants | Nonimmigrants | 1.9 /100 | #237 | Tragic 42.9% |
| Iroquois | 1.7 /100 | #238 | Tragic 42.8% |
Demographics Similar to Ethiopians by Associate's Degree
In terms of associate's degree, the demographic groups most similar to Ethiopians are Immigrants from Eastern Europe (50.5%, a difference of 0.010%), Armenian (50.4%, a difference of 0.030%), Immigrants from Lebanon (50.5%, a difference of 0.060%), Immigrants from Zimbabwe (50.5%, a difference of 0.090%), and Maltese (50.4%, a difference of 0.10%).
| Demographics | Rating | Rank | Associate's Degree |
| Immigrants | Pakistan | 99.5 /100 | #72 | Exceptional 50.9% |
| Carpatho Rusyns | 99.3 /100 | #73 | Exceptional 50.6% |
| Lithuanians | 99.3 /100 | #74 | Exceptional 50.6% |
| Immigrants | Scotland | 99.3 /100 | #75 | Exceptional 50.6% |
| Immigrants | Zimbabwe | 99.2 /100 | #76 | Exceptional 50.5% |
| Immigrants | Lebanon | 99.1 /100 | #77 | Exceptional 50.5% |
| Immigrants | Eastern Europe | 99.1 /100 | #78 | Exceptional 50.5% |
| Ethiopians | 99.1 /100 | #79 | Exceptional 50.4% |
| Armenians | 99.1 /100 | #80 | Exceptional 50.4% |
| Maltese | 99.1 /100 | #81 | Exceptional 50.4% |
| Greeks | 98.9 /100 | #82 | Exceptional 50.3% |
| Immigrants | Uzbekistan | 98.9 /100 | #83 | Exceptional 50.3% |
| Immigrants | Hungary | 98.9 /100 | #84 | Exceptional 50.2% |
| Immigrants | Egypt | 98.9 /100 | #85 | Exceptional 50.2% |
| Immigrants | Croatia | 98.9 /100 | #86 | Exceptional 50.2% |