Liberian vs British Associate's Degree
COMPARE
Liberian
British
Associate's Degree
Associate's Degree Comparison
Liberians
British
43.3%
ASSOCIATE'S DEGREE
2.9/ 100
METRIC RATING
231st/ 347
METRIC RANK
48.9%
ASSOCIATE'S DEGREE
95.0/ 100
METRIC RATING
116th/ 347
METRIC RANK
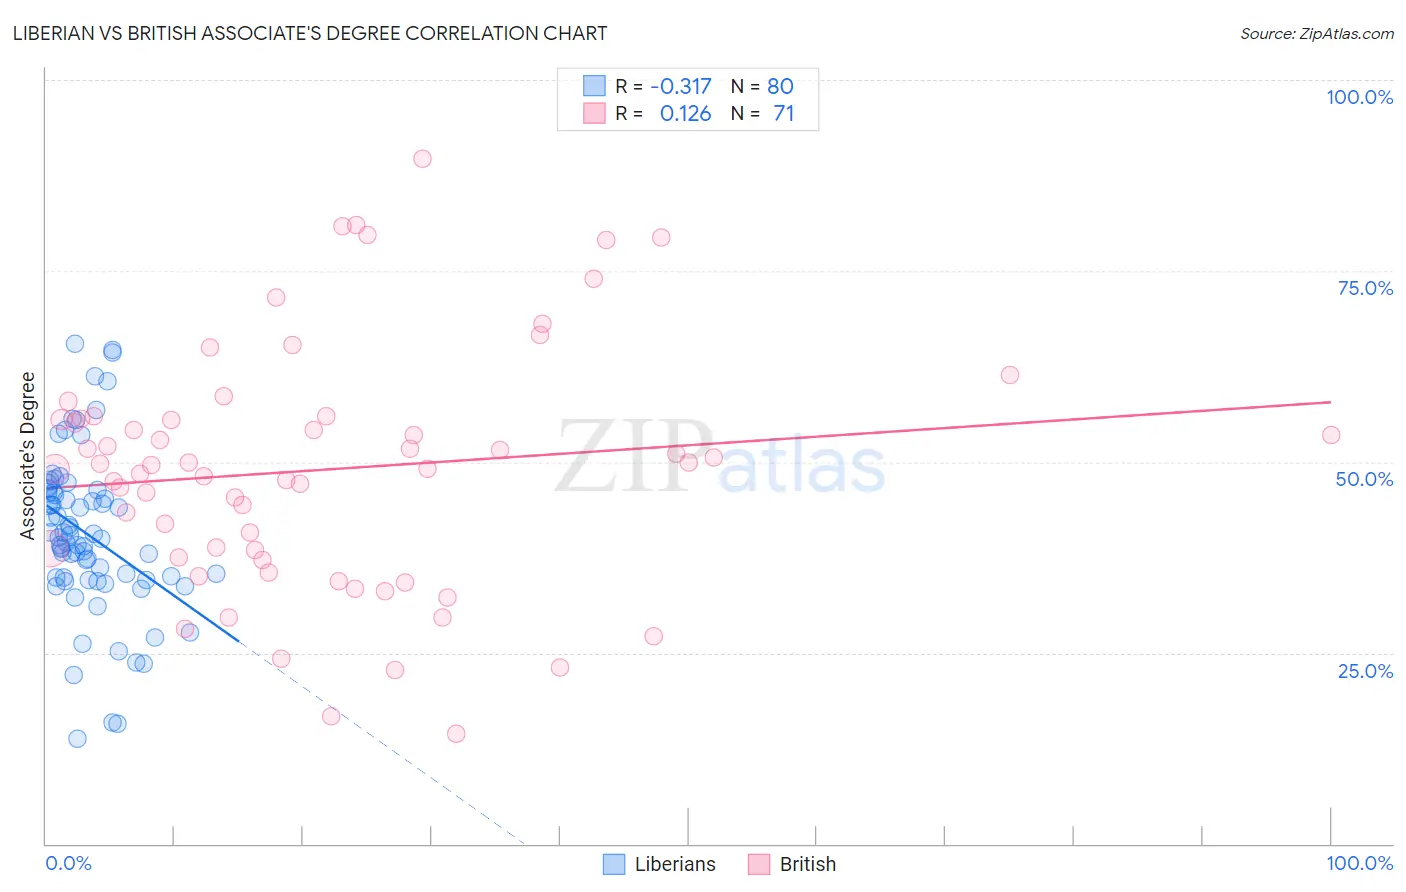
Liberian vs British Associate's Degree Correlation Chart
The statistical analysis conducted on geographies consisting of 118,102,624 people shows a mild negative correlation between the proportion of Liberians and percentage of population with at least associate's degree education in the United States with a correlation coefficient (R) of -0.317 and weighted average of 43.3%. Similarly, the statistical analysis conducted on geographies consisting of 531,402,348 people shows a poor positive correlation between the proportion of British and percentage of population with at least associate's degree education in the United States with a correlation coefficient (R) of 0.126 and weighted average of 48.9%, a difference of 12.9%.
Associate's Degree Correlation Summary
| Measurement | Liberian | British |
| Minimum | 13.8% | 14.3% |
| Maximum | 65.5% | 89.7% |
| Range | 51.7% | 75.3% |
| Mean | 40.5% | 49.0% |
| Median | 39.9% | 49.7% |
| Interquartile 25% (IQ1) | 34.7% | 37.4% |
| Interquartile 75% (IQ3) | 45.9% | 55.7% |
| Interquartile Range (IQR) | 11.3% | 18.3% |
| Standard Deviation (Sample) | 10.6% | 15.9% |
| Standard Deviation (Population) | 10.5% | 15.8% |
Similar Demographics by Associate's Degree
Demographics Similar to Liberians by Associate's Degree
In terms of associate's degree, the demographic groups most similar to Liberians are Immigrants from Barbados (43.3%, a difference of 0.010%), Immigrants from Trinidad and Tobago (43.3%, a difference of 0.080%), Hmong (43.4%, a difference of 0.23%), Native Hawaiian (43.1%, a difference of 0.43%), and Tongan (43.0%, a difference of 0.59%).
| Demographics | Rating | Rank | Associate's Degree |
| West Indians | 5.2 /100 | #224 | Tragic 43.8% |
| Guamanians/Chamorros | 4.8 /100 | #225 | Tragic 43.8% |
| Immigrants | Burma/Myanmar | 4.3 /100 | #226 | Tragic 43.7% |
| Trinidadians and Tobagonians | 4.0 /100 | #227 | Tragic 43.6% |
| Hmong | 3.2 /100 | #228 | Tragic 43.4% |
| Immigrants | Trinidad and Tobago | 3.0 /100 | #229 | Tragic 43.3% |
| Immigrants | Barbados | 2.9 /100 | #230 | Tragic 43.3% |
| Liberians | 2.9 /100 | #231 | Tragic 43.3% |
| Native Hawaiians | 2.3 /100 | #232 | Tragic 43.1% |
| Tongans | 2.2 /100 | #233 | Tragic 43.0% |
| Tlingit-Haida | 2.1 /100 | #234 | Tragic 43.0% |
| Ecuadorians | 2.0 /100 | #235 | Tragic 43.0% |
| Immigrants | St. Vincent and the Grenadines | 1.9 /100 | #236 | Tragic 42.9% |
| Immigrants | Nonimmigrants | 1.9 /100 | #237 | Tragic 42.9% |
| Iroquois | 1.7 /100 | #238 | Tragic 42.8% |
Demographics Similar to British by Associate's Degree
In terms of associate's degree, the demographic groups most similar to British are Afghan (48.9%, a difference of 0.040%), Luxembourger (48.9%, a difference of 0.070%), Albanian (48.8%, a difference of 0.11%), Lebanese (48.8%, a difference of 0.12%), and Palestinian (49.0%, a difference of 0.13%).
| Demographics | Rating | Rank | Associate's Degree |
| Immigrants | Morocco | 96.3 /100 | #109 | Exceptional 49.2% |
| Austrians | 95.8 /100 | #110 | Exceptional 49.1% |
| Immigrants | Venezuela | 95.8 /100 | #111 | Exceptional 49.1% |
| Immigrants | Chile | 95.3 /100 | #112 | Exceptional 49.0% |
| Palestinians | 95.3 /100 | #113 | Exceptional 49.0% |
| Arabs | 95.3 /100 | #114 | Exceptional 49.0% |
| Luxembourgers | 95.1 /100 | #115 | Exceptional 48.9% |
| British | 95.0 /100 | #116 | Exceptional 48.9% |
| Afghans | 94.8 /100 | #117 | Exceptional 48.9% |
| Albanians | 94.7 /100 | #118 | Exceptional 48.8% |
| Lebanese | 94.6 /100 | #119 | Exceptional 48.8% |
| Alsatians | 94.6 /100 | #120 | Exceptional 48.8% |
| Ugandans | 93.9 /100 | #121 | Exceptional 48.7% |
| Italians | 93.9 /100 | #122 | Exceptional 48.7% |
| Brazilians | 93.7 /100 | #123 | Exceptional 48.7% |