Immigrants from Northern Africa vs Ethiopian Associate's Degree
COMPARE
Immigrants from Northern Africa
Ethiopian
Associate's Degree
Associate's Degree Comparison
Immigrants from Northern Africa
Ethiopians
49.7%
ASSOCIATE'S DEGREE
97.9/ 100
METRIC RATING
98th/ 347
METRIC RANK
50.4%
ASSOCIATE'S DEGREE
99.1/ 100
METRIC RATING
79th/ 347
METRIC RANK
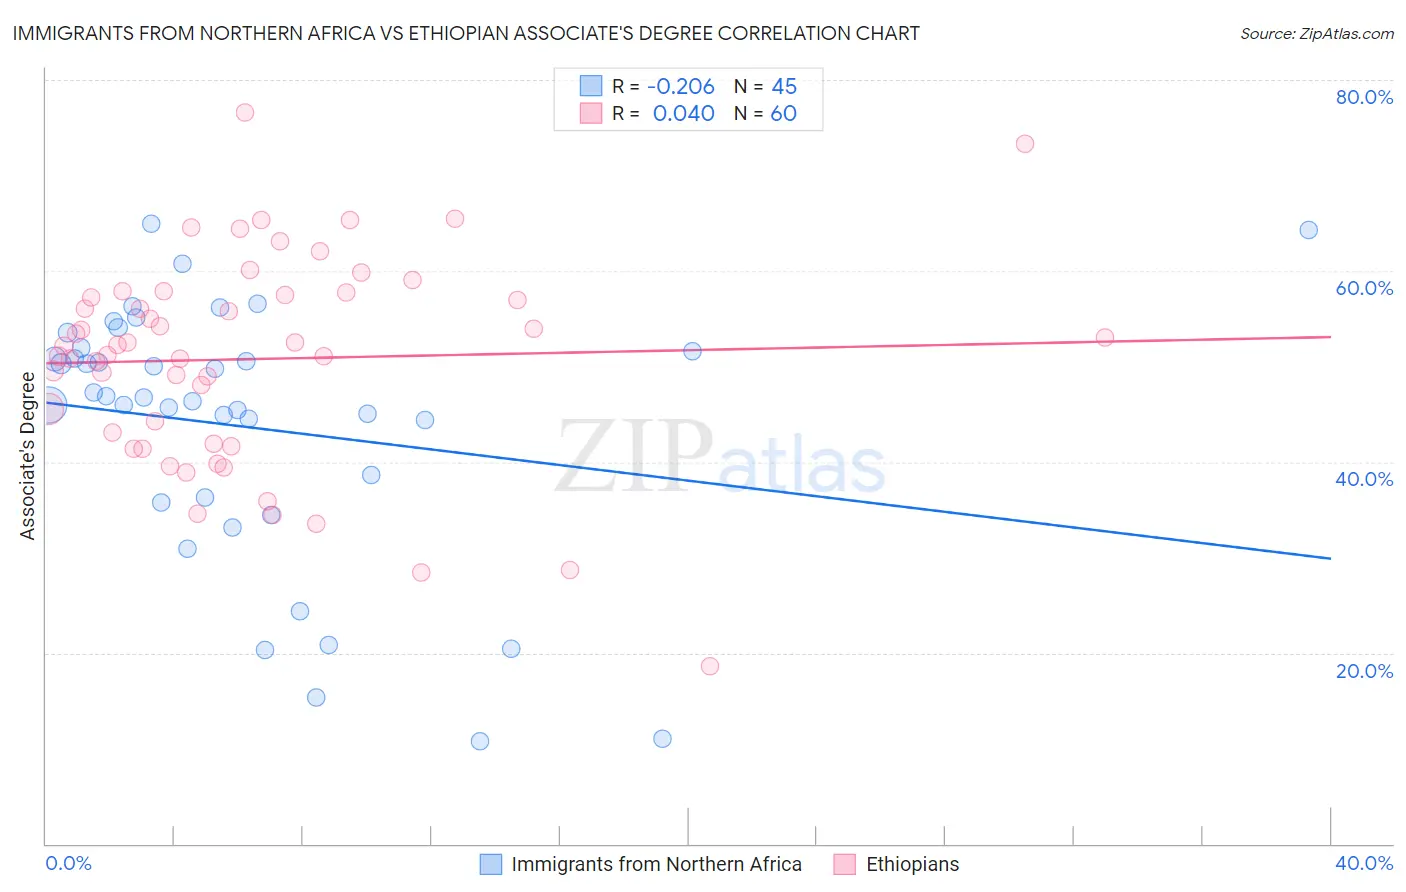
Immigrants from Northern Africa vs Ethiopian Associate's Degree Correlation Chart
The statistical analysis conducted on geographies consisting of 321,197,052 people shows a weak negative correlation between the proportion of Immigrants from Northern Africa and percentage of population with at least associate's degree education in the United States with a correlation coefficient (R) of -0.206 and weighted average of 49.7%. Similarly, the statistical analysis conducted on geographies consisting of 223,259,495 people shows no correlation between the proportion of Ethiopians and percentage of population with at least associate's degree education in the United States with a correlation coefficient (R) of 0.040 and weighted average of 50.4%, a difference of 1.5%.
Associate's Degree Correlation Summary
| Measurement | Immigrants from Northern Africa | Ethiopian |
| Minimum | 10.8% | 18.6% |
| Maximum | 65.0% | 76.6% |
| Range | 54.2% | 58.0% |
| Mean | 43.6% | 50.8% |
| Median | 46.7% | 52.2% |
| Interquartile 25% (IQ1) | 36.0% | 42.5% |
| Interquartile 75% (IQ3) | 51.8% | 57.6% |
| Interquartile Range (IQR) | 15.8% | 15.1% |
| Standard Deviation (Sample) | 13.6% | 11.1% |
| Standard Deviation (Population) | 13.4% | 11.0% |
Demographics Similar to Immigrants from Northern Africa and Ethiopians by Associate's Degree
In terms of associate's degree, the demographic groups most similar to Immigrants from Northern Africa are Romanian (49.7%, a difference of 0.090%), Immigrants from Ukraine (49.7%, a difference of 0.090%), Immigrants from England (49.7%, a difference of 0.11%), Laotian (49.9%, a difference of 0.50%), and Immigrants from Brazil (50.0%, a difference of 0.63%). Similarly, the demographic groups most similar to Ethiopians are Immigrants from Eastern Europe (50.5%, a difference of 0.010%), Armenian (50.4%, a difference of 0.030%), Maltese (50.4%, a difference of 0.10%), Greek (50.3%, a difference of 0.33%), and Immigrants from Uzbekistan (50.3%, a difference of 0.37%).
| Demographics | Rating | Rank | Associate's Degree |
| Immigrants | Eastern Europe | 99.1 /100 | #78 | Exceptional 50.5% |
| Ethiopians | 99.1 /100 | #79 | Exceptional 50.4% |
| Armenians | 99.1 /100 | #80 | Exceptional 50.4% |
| Maltese | 99.1 /100 | #81 | Exceptional 50.4% |
| Greeks | 98.9 /100 | #82 | Exceptional 50.3% |
| Immigrants | Uzbekistan | 98.9 /100 | #83 | Exceptional 50.3% |
| Immigrants | Hungary | 98.9 /100 | #84 | Exceptional 50.2% |
| Immigrants | Egypt | 98.9 /100 | #85 | Exceptional 50.2% |
| Immigrants | Croatia | 98.9 /100 | #86 | Exceptional 50.2% |
| Immigrants | Moldova | 98.8 /100 | #87 | Exceptional 50.2% |
| Immigrants | Canada | 98.7 /100 | #88 | Exceptional 50.1% |
| Immigrants | Western Europe | 98.7 /100 | #89 | Exceptional 50.1% |
| Immigrants | Ethiopia | 98.7 /100 | #90 | Exceptional 50.1% |
| Immigrants | Western Asia | 98.7 /100 | #91 | Exceptional 50.1% |
| Immigrants | North America | 98.7 /100 | #92 | Exceptional 50.1% |
| Immigrants | Brazil | 98.5 /100 | #93 | Exceptional 50.0% |
| Laotians | 98.4 /100 | #94 | Exceptional 49.9% |
| Immigrants | England | 98.0 /100 | #95 | Exceptional 49.7% |
| Romanians | 98.0 /100 | #96 | Exceptional 49.7% |
| Immigrants | Ukraine | 98.0 /100 | #97 | Exceptional 49.7% |
| Immigrants | Northern Africa | 97.9 /100 | #98 | Exceptional 49.7% |