Liberian vs Immigrants from Somalia Associate's Degree
COMPARE
Liberian
Immigrants from Somalia
Associate's Degree
Associate's Degree Comparison
Liberians
Immigrants from Somalia
43.3%
ASSOCIATE'S DEGREE
2.9/ 100
METRIC RATING
231st/ 347
METRIC RANK
46.5%
ASSOCIATE'S DEGREE
55.5/ 100
METRIC RATING
168th/ 347
METRIC RANK
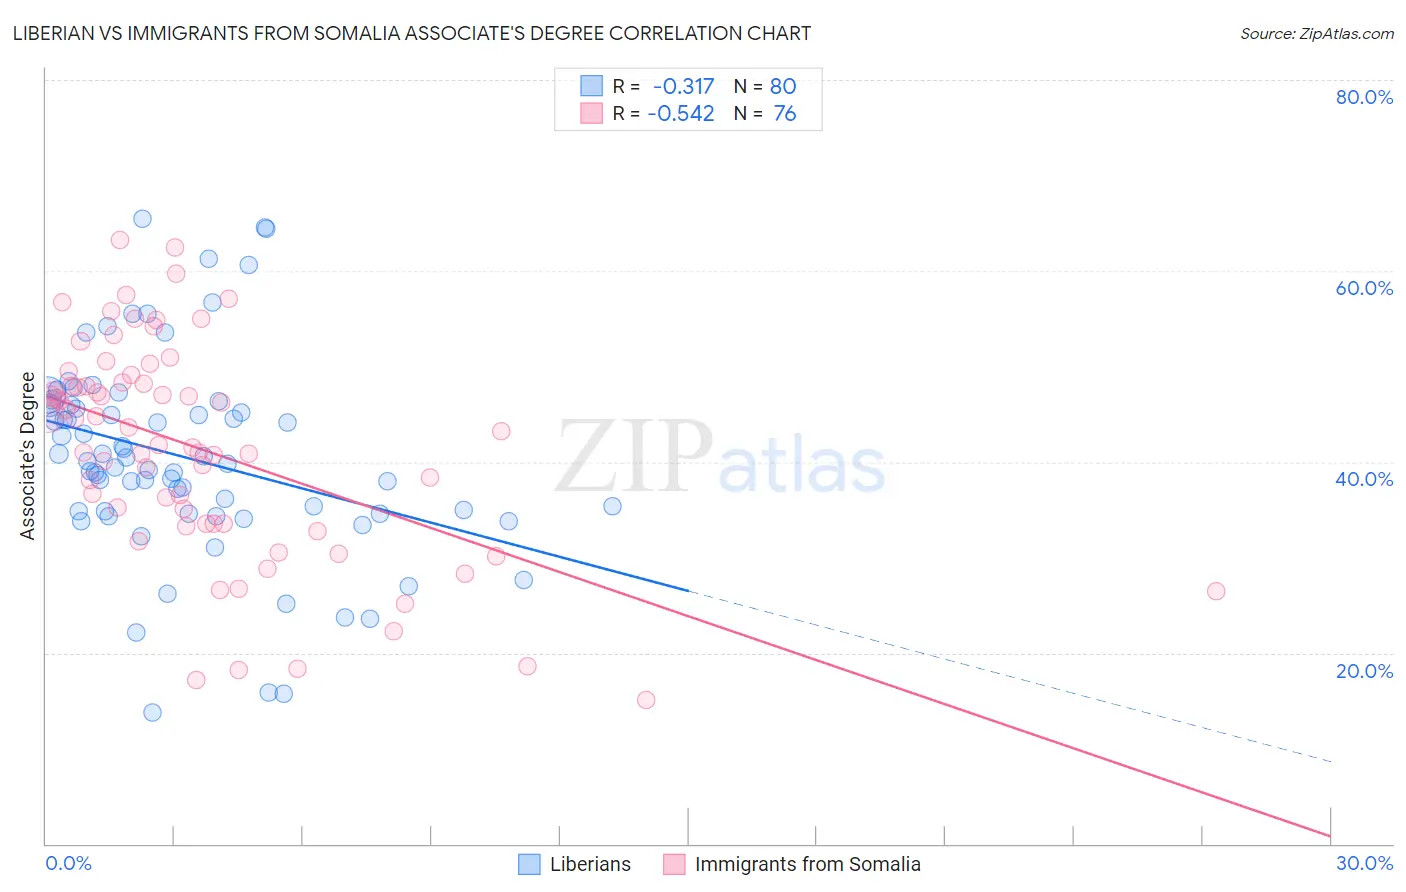
Liberian vs Immigrants from Somalia Associate's Degree Correlation Chart
The statistical analysis conducted on geographies consisting of 118,102,624 people shows a mild negative correlation between the proportion of Liberians and percentage of population with at least associate's degree education in the United States with a correlation coefficient (R) of -0.317 and weighted average of 43.3%. Similarly, the statistical analysis conducted on geographies consisting of 92,111,755 people shows a substantial negative correlation between the proportion of Immigrants from Somalia and percentage of population with at least associate's degree education in the United States with a correlation coefficient (R) of -0.542 and weighted average of 46.5%, a difference of 7.5%.
Associate's Degree Correlation Summary
| Measurement | Liberian | Immigrants from Somalia |
| Minimum | 13.8% | 15.0% |
| Maximum | 65.5% | 63.3% |
| Range | 51.7% | 48.3% |
| Mean | 40.5% | 41.3% |
| Median | 39.9% | 42.5% |
| Interquartile 25% (IQ1) | 34.7% | 33.5% |
| Interquartile 75% (IQ3) | 45.9% | 48.3% |
| Interquartile Range (IQR) | 11.3% | 14.8% |
| Standard Deviation (Sample) | 10.6% | 11.3% |
| Standard Deviation (Population) | 10.5% | 11.2% |
Similar Demographics by Associate's Degree
Demographics Similar to Liberians by Associate's Degree
In terms of associate's degree, the demographic groups most similar to Liberians are Immigrants from Barbados (43.3%, a difference of 0.010%), Immigrants from Trinidad and Tobago (43.3%, a difference of 0.080%), Hmong (43.4%, a difference of 0.23%), Native Hawaiian (43.1%, a difference of 0.43%), and Tongan (43.0%, a difference of 0.59%).
| Demographics | Rating | Rank | Associate's Degree |
| West Indians | 5.2 /100 | #224 | Tragic 43.8% |
| Guamanians/Chamorros | 4.8 /100 | #225 | Tragic 43.8% |
| Immigrants | Burma/Myanmar | 4.3 /100 | #226 | Tragic 43.7% |
| Trinidadians and Tobagonians | 4.0 /100 | #227 | Tragic 43.6% |
| Hmong | 3.2 /100 | #228 | Tragic 43.4% |
| Immigrants | Trinidad and Tobago | 3.0 /100 | #229 | Tragic 43.3% |
| Immigrants | Barbados | 2.9 /100 | #230 | Tragic 43.3% |
| Liberians | 2.9 /100 | #231 | Tragic 43.3% |
| Native Hawaiians | 2.3 /100 | #232 | Tragic 43.1% |
| Tongans | 2.2 /100 | #233 | Tragic 43.0% |
| Tlingit-Haida | 2.1 /100 | #234 | Tragic 43.0% |
| Ecuadorians | 2.0 /100 | #235 | Tragic 43.0% |
| Immigrants | St. Vincent and the Grenadines | 1.9 /100 | #236 | Tragic 42.9% |
| Immigrants | Nonimmigrants | 1.9 /100 | #237 | Tragic 42.9% |
| Iroquois | 1.7 /100 | #238 | Tragic 42.8% |
Demographics Similar to Immigrants from Somalia by Associate's Degree
In terms of associate's degree, the demographic groups most similar to Immigrants from Somalia are Uruguayan (46.5%, a difference of 0.010%), Irish (46.5%, a difference of 0.14%), Basque (46.5%, a difference of 0.20%), Hungarian (46.7%, a difference of 0.29%), and Immigrants from Sierra Leone (46.7%, a difference of 0.29%).
| Demographics | Rating | Rank | Associate's Degree |
| Scandinavians | 65.2 /100 | #161 | Good 46.9% |
| Immigrants | Africa | 63.2 /100 | #162 | Good 46.8% |
| Somalis | 62.5 /100 | #163 | Good 46.8% |
| Colombians | 62.4 /100 | #164 | Good 46.8% |
| Immigrants | South America | 59.9 /100 | #165 | Average 46.7% |
| Hungarians | 59.3 /100 | #166 | Average 46.7% |
| Immigrants | Sierra Leone | 59.2 /100 | #167 | Average 46.7% |
| Immigrants | Somalia | 55.5 /100 | #168 | Average 46.5% |
| Uruguayans | 55.4 /100 | #169 | Average 46.5% |
| Irish | 53.6 /100 | #170 | Average 46.5% |
| Basques | 52.8 /100 | #171 | Average 46.5% |
| Peruvians | 50.5 /100 | #172 | Average 46.4% |
| Immigrants | Iraq | 50.3 /100 | #173 | Average 46.4% |
| English | 50.0 /100 | #174 | Average 46.4% |
| Belgians | 48.9 /100 | #175 | Average 46.3% |