Afghan vs Ethiopian Associate's Degree
COMPARE
Afghan
Ethiopian
Associate's Degree
Associate's Degree Comparison
Afghans
Ethiopians
48.9%
ASSOCIATE'S DEGREE
94.8/ 100
METRIC RATING
117th/ 347
METRIC RANK
50.4%
ASSOCIATE'S DEGREE
99.1/ 100
METRIC RATING
79th/ 347
METRIC RANK
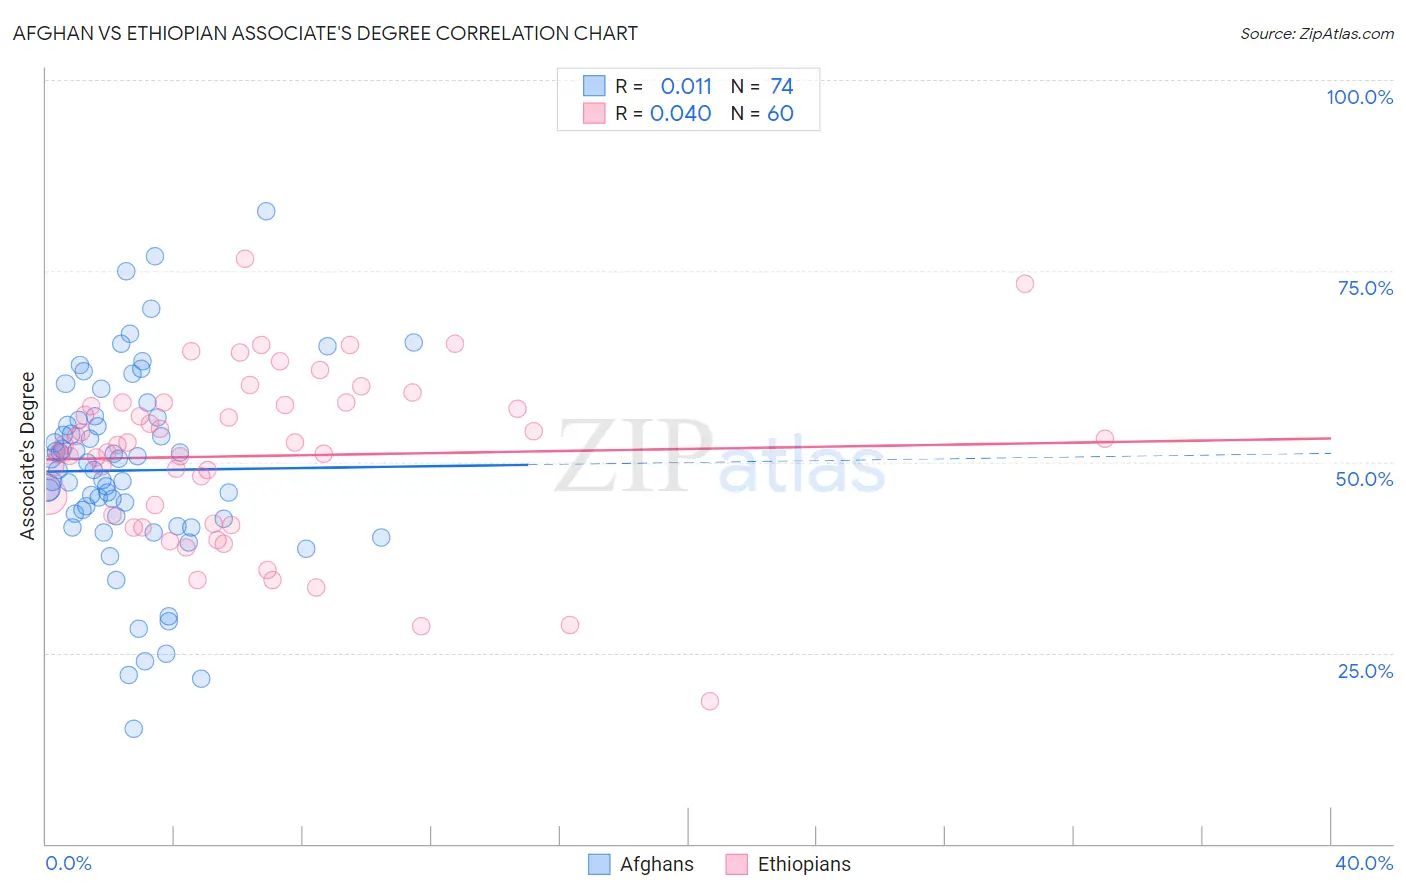
Afghan vs Ethiopian Associate's Degree Correlation Chart
The statistical analysis conducted on geographies consisting of 148,873,892 people shows no correlation between the proportion of Afghans and percentage of population with at least associate's degree education in the United States with a correlation coefficient (R) of 0.011 and weighted average of 48.9%. Similarly, the statistical analysis conducted on geographies consisting of 223,259,495 people shows no correlation between the proportion of Ethiopians and percentage of population with at least associate's degree education in the United States with a correlation coefficient (R) of 0.040 and weighted average of 50.4%, a difference of 3.2%.
Associate's Degree Correlation Summary
| Measurement | Afghan | Ethiopian |
| Minimum | 15.1% | 18.6% |
| Maximum | 82.8% | 76.6% |
| Range | 67.7% | 58.0% |
| Mean | 48.9% | 50.8% |
| Median | 48.9% | 52.2% |
| Interquartile 25% (IQ1) | 42.6% | 42.5% |
| Interquartile 75% (IQ3) | 55.5% | 57.6% |
| Interquartile Range (IQR) | 12.9% | 15.1% |
| Standard Deviation (Sample) | 12.8% | 11.1% |
| Standard Deviation (Population) | 12.7% | 11.0% |
Similar Demographics by Associate's Degree
Demographics Similar to Afghans by Associate's Degree
In terms of associate's degree, the demographic groups most similar to Afghans are British (48.9%, a difference of 0.040%), Albanian (48.8%, a difference of 0.060%), Lebanese (48.8%, a difference of 0.070%), Alsatian (48.8%, a difference of 0.10%), and Luxembourger (48.9%, a difference of 0.11%).
| Demographics | Rating | Rank | Associate's Degree |
| Austrians | 95.8 /100 | #110 | Exceptional 49.1% |
| Immigrants | Venezuela | 95.8 /100 | #111 | Exceptional 49.1% |
| Immigrants | Chile | 95.3 /100 | #112 | Exceptional 49.0% |
| Palestinians | 95.3 /100 | #113 | Exceptional 49.0% |
| Arabs | 95.3 /100 | #114 | Exceptional 49.0% |
| Luxembourgers | 95.1 /100 | #115 | Exceptional 48.9% |
| British | 95.0 /100 | #116 | Exceptional 48.9% |
| Afghans | 94.8 /100 | #117 | Exceptional 48.9% |
| Albanians | 94.7 /100 | #118 | Exceptional 48.8% |
| Lebanese | 94.6 /100 | #119 | Exceptional 48.8% |
| Alsatians | 94.6 /100 | #120 | Exceptional 48.8% |
| Ugandans | 93.9 /100 | #121 | Exceptional 48.7% |
| Italians | 93.9 /100 | #122 | Exceptional 48.7% |
| Brazilians | 93.7 /100 | #123 | Exceptional 48.7% |
| Serbians | 92.6 /100 | #124 | Exceptional 48.5% |
Demographics Similar to Ethiopians by Associate's Degree
In terms of associate's degree, the demographic groups most similar to Ethiopians are Immigrants from Eastern Europe (50.5%, a difference of 0.010%), Armenian (50.4%, a difference of 0.030%), Immigrants from Lebanon (50.5%, a difference of 0.060%), Immigrants from Zimbabwe (50.5%, a difference of 0.090%), and Maltese (50.4%, a difference of 0.10%).
| Demographics | Rating | Rank | Associate's Degree |
| Immigrants | Pakistan | 99.5 /100 | #72 | Exceptional 50.9% |
| Carpatho Rusyns | 99.3 /100 | #73 | Exceptional 50.6% |
| Lithuanians | 99.3 /100 | #74 | Exceptional 50.6% |
| Immigrants | Scotland | 99.3 /100 | #75 | Exceptional 50.6% |
| Immigrants | Zimbabwe | 99.2 /100 | #76 | Exceptional 50.5% |
| Immigrants | Lebanon | 99.1 /100 | #77 | Exceptional 50.5% |
| Immigrants | Eastern Europe | 99.1 /100 | #78 | Exceptional 50.5% |
| Ethiopians | 99.1 /100 | #79 | Exceptional 50.4% |
| Armenians | 99.1 /100 | #80 | Exceptional 50.4% |
| Maltese | 99.1 /100 | #81 | Exceptional 50.4% |
| Greeks | 98.9 /100 | #82 | Exceptional 50.3% |
| Immigrants | Uzbekistan | 98.9 /100 | #83 | Exceptional 50.3% |
| Immigrants | Hungary | 98.9 /100 | #84 | Exceptional 50.2% |
| Immigrants | Egypt | 98.9 /100 | #85 | Exceptional 50.2% |
| Immigrants | Croatia | 98.9 /100 | #86 | Exceptional 50.2% |