Liberian vs Immigrants from Asia Associate's Degree
COMPARE
Liberian
Immigrants from Asia
Associate's Degree
Associate's Degree Comparison
Liberians
Immigrants from Asia
43.3%
ASSOCIATE'S DEGREE
2.9/ 100
METRIC RATING
231st/ 347
METRIC RANK
52.0%
ASSOCIATE'S DEGREE
99.8/ 100
METRIC RATING
53rd/ 347
METRIC RANK
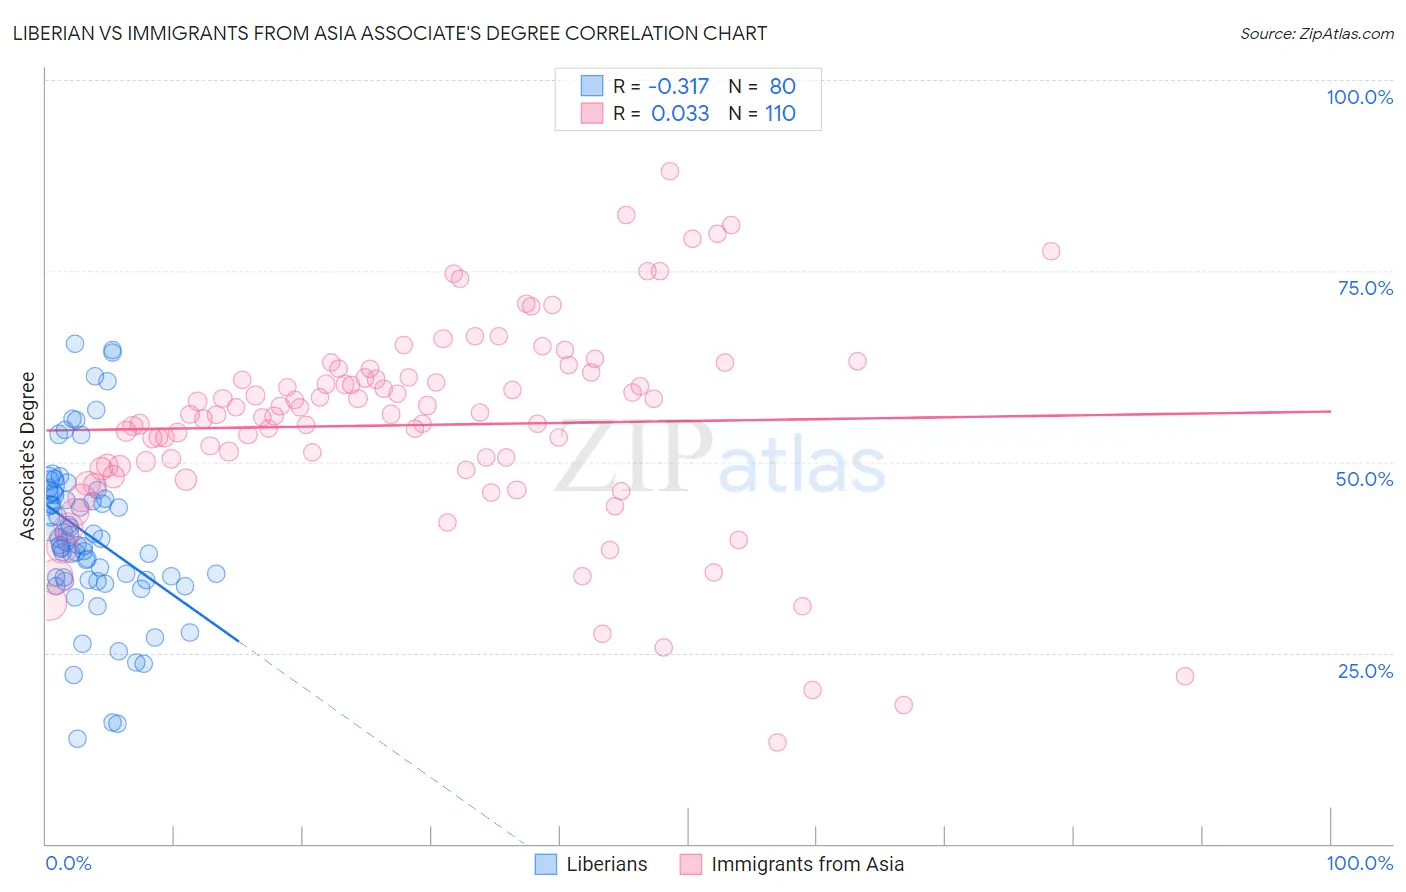
Liberian vs Immigrants from Asia Associate's Degree Correlation Chart
The statistical analysis conducted on geographies consisting of 118,102,624 people shows a mild negative correlation between the proportion of Liberians and percentage of population with at least associate's degree education in the United States with a correlation coefficient (R) of -0.317 and weighted average of 43.3%. Similarly, the statistical analysis conducted on geographies consisting of 549,095,102 people shows no correlation between the proportion of Immigrants from Asia and percentage of population with at least associate's degree education in the United States with a correlation coefficient (R) of 0.033 and weighted average of 52.0%, a difference of 20.0%.
Associate's Degree Correlation Summary
| Measurement | Liberian | Immigrants from Asia |
| Minimum | 13.8% | 13.2% |
| Maximum | 65.5% | 88.0% |
| Range | 51.7% | 74.8% |
| Mean | 40.5% | 54.8% |
| Median | 39.9% | 56.2% |
| Interquartile 25% (IQ1) | 34.7% | 49.0% |
| Interquartile 75% (IQ3) | 45.9% | 61.1% |
| Interquartile Range (IQR) | 11.3% | 12.0% |
| Standard Deviation (Sample) | 10.6% | 13.4% |
| Standard Deviation (Population) | 10.5% | 13.4% |
Similar Demographics by Associate's Degree
Demographics Similar to Liberians by Associate's Degree
In terms of associate's degree, the demographic groups most similar to Liberians are Immigrants from Barbados (43.3%, a difference of 0.010%), Immigrants from Trinidad and Tobago (43.3%, a difference of 0.080%), Hmong (43.4%, a difference of 0.23%), Native Hawaiian (43.1%, a difference of 0.43%), and Tongan (43.0%, a difference of 0.59%).
| Demographics | Rating | Rank | Associate's Degree |
| West Indians | 5.2 /100 | #224 | Tragic 43.8% |
| Guamanians/Chamorros | 4.8 /100 | #225 | Tragic 43.8% |
| Immigrants | Burma/Myanmar | 4.3 /100 | #226 | Tragic 43.7% |
| Trinidadians and Tobagonians | 4.0 /100 | #227 | Tragic 43.6% |
| Hmong | 3.2 /100 | #228 | Tragic 43.4% |
| Immigrants | Trinidad and Tobago | 3.0 /100 | #229 | Tragic 43.3% |
| Immigrants | Barbados | 2.9 /100 | #230 | Tragic 43.3% |
| Liberians | 2.9 /100 | #231 | Tragic 43.3% |
| Native Hawaiians | 2.3 /100 | #232 | Tragic 43.1% |
| Tongans | 2.2 /100 | #233 | Tragic 43.0% |
| Tlingit-Haida | 2.1 /100 | #234 | Tragic 43.0% |
| Ecuadorians | 2.0 /100 | #235 | Tragic 43.0% |
| Immigrants | St. Vincent and the Grenadines | 1.9 /100 | #236 | Tragic 42.9% |
| Immigrants | Nonimmigrants | 1.9 /100 | #237 | Tragic 42.9% |
| Iroquois | 1.7 /100 | #238 | Tragic 42.8% |
Demographics Similar to Immigrants from Asia by Associate's Degree
In terms of associate's degree, the demographic groups most similar to Immigrants from Asia are Bolivian (52.0%, a difference of 0.020%), Immigrants from Spain (51.9%, a difference of 0.10%), Australian (51.9%, a difference of 0.13%), Immigrants from Czechoslovakia (51.9%, a difference of 0.15%), and Immigrants from Greece (52.1%, a difference of 0.23%).
| Demographics | Rating | Rank | Associate's Degree |
| Immigrants | Bulgaria | 99.9 /100 | #46 | Exceptional 52.4% |
| Immigrants | Kuwait | 99.9 /100 | #47 | Exceptional 52.4% |
| Immigrants | Norway | 99.9 /100 | #48 | Exceptional 52.2% |
| Immigrants | Austria | 99.9 /100 | #49 | Exceptional 52.1% |
| Asians | 99.9 /100 | #50 | Exceptional 52.1% |
| Immigrants | Greece | 99.9 /100 | #51 | Exceptional 52.1% |
| Bolivians | 99.8 /100 | #52 | Exceptional 52.0% |
| Immigrants | Asia | 99.8 /100 | #53 | Exceptional 52.0% |
| Immigrants | Spain | 99.8 /100 | #54 | Exceptional 51.9% |
| Australians | 99.8 /100 | #55 | Exceptional 51.9% |
| Immigrants | Czechoslovakia | 99.8 /100 | #56 | Exceptional 51.9% |
| Paraguayans | 99.8 /100 | #57 | Exceptional 51.8% |
| New Zealanders | 99.8 /100 | #58 | Exceptional 51.8% |
| Immigrants | Serbia | 99.8 /100 | #59 | Exceptional 51.7% |
| Immigrants | Bolivia | 99.7 /100 | #60 | Exceptional 51.5% |