Liberian vs Ethiopian Single Male Poverty
COMPARE
Liberian
Ethiopian
Single Male Poverty
Single Male Poverty Comparison
Liberians
Ethiopians
13.0%
SINGLE MALE POVERTY
25.2/ 100
METRIC RATING
194th/ 347
METRIC RANK
11.2%
SINGLE MALE POVERTY
100.0/ 100
METRIC RATING
20th/ 347
METRIC RANK
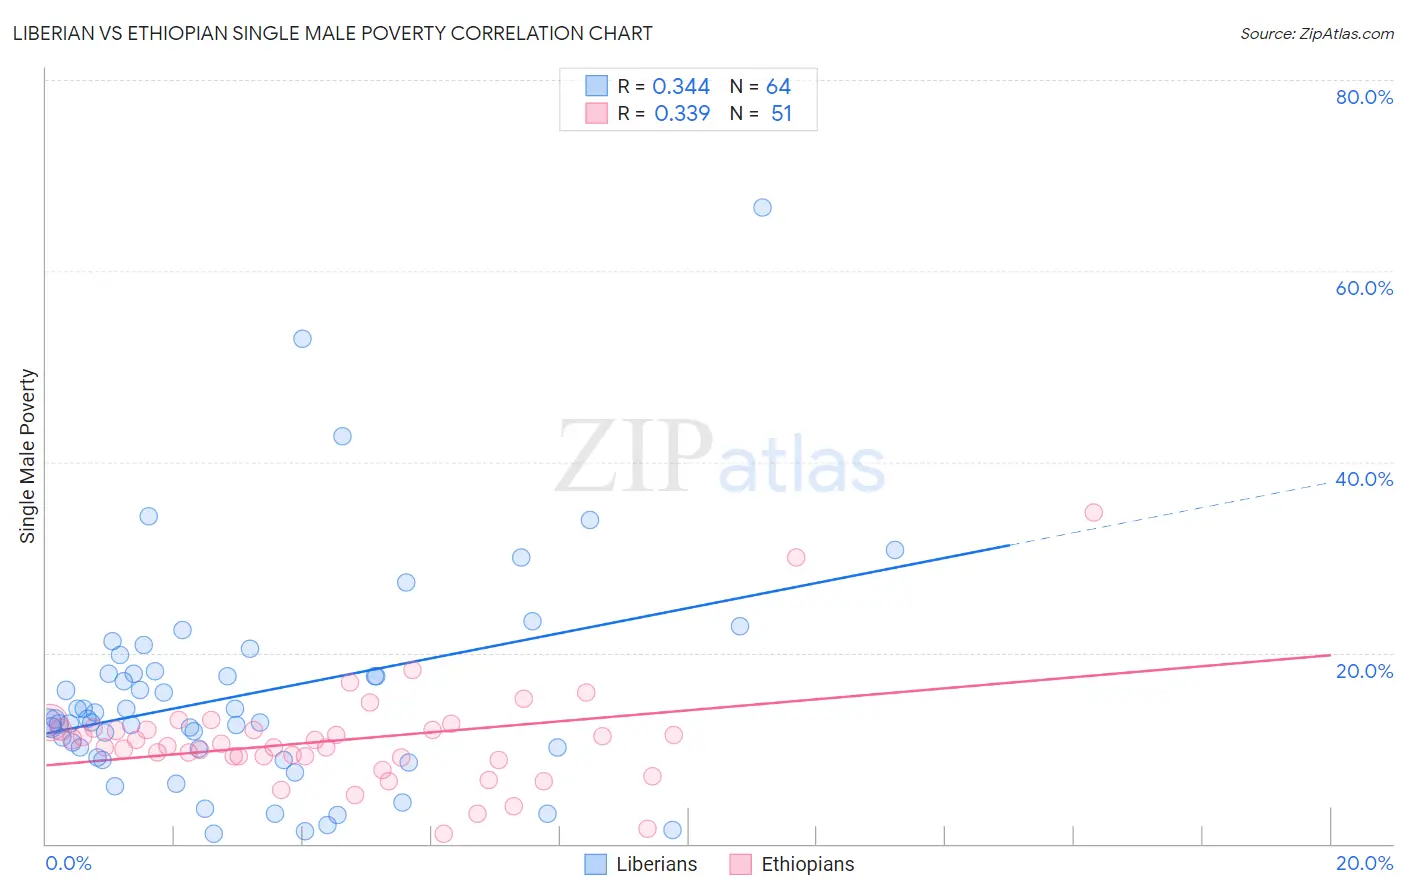
Liberian vs Ethiopian Single Male Poverty Correlation Chart
The statistical analysis conducted on geographies consisting of 112,749,237 people shows a mild positive correlation between the proportion of Liberians and poverty level among single males in the United States with a correlation coefficient (R) of 0.344 and weighted average of 13.0%. Similarly, the statistical analysis conducted on geographies consisting of 207,684,975 people shows a mild positive correlation between the proportion of Ethiopians and poverty level among single males in the United States with a correlation coefficient (R) of 0.339 and weighted average of 11.2%, a difference of 16.3%.
Single Male Poverty Correlation Summary
| Measurement | Liberian | Ethiopian |
| Minimum | 1.0% | 1.1% |
| Maximum | 66.7% | 34.7% |
| Range | 65.7% | 33.6% |
| Mean | 15.7% | 10.9% |
| Median | 12.9% | 10.2% |
| Interquartile 25% (IQ1) | 9.5% | 9.1% |
| Interquartile 75% (IQ3) | 17.9% | 11.9% |
| Interquartile Range (IQR) | 8.4% | 2.8% |
| Standard Deviation (Sample) | 11.6% | 5.6% |
| Standard Deviation (Population) | 11.5% | 5.5% |
Similar Demographics by Single Male Poverty
Demographics Similar to Liberians by Single Male Poverty
In terms of single male poverty, the demographic groups most similar to Liberians are Immigrants from South Africa (13.0%, a difference of 0.070%), Immigrants from Thailand (13.0%, a difference of 0.090%), Immigrants from Jamaica (13.0%, a difference of 0.090%), Arab (13.0%, a difference of 0.12%), and Immigrants from England (13.0%, a difference of 0.13%).
| Demographics | Rating | Rank | Single Male Poverty |
| Immigrants | Kuwait | 31.9 /100 | #187 | Fair 12.9% |
| Macedonians | 31.5 /100 | #188 | Fair 12.9% |
| Portuguese | 30.2 /100 | #189 | Fair 12.9% |
| Arabs | 27.0 /100 | #190 | Fair 13.0% |
| Immigrants | Thailand | 26.6 /100 | #191 | Fair 13.0% |
| Immigrants | Jamaica | 26.5 /100 | #192 | Fair 13.0% |
| Immigrants | South Africa | 26.1 /100 | #193 | Fair 13.0% |
| Liberians | 25.2 /100 | #194 | Fair 13.0% |
| Immigrants | England | 23.4 /100 | #195 | Fair 13.0% |
| Immigrants | Grenada | 23.1 /100 | #196 | Fair 13.0% |
| Immigrants | Laos | 23.1 /100 | #197 | Fair 13.0% |
| Lithuanians | 22.1 /100 | #198 | Fair 13.0% |
| Immigrants | Norway | 21.8 /100 | #199 | Fair 13.0% |
| Slovenes | 21.6 /100 | #200 | Fair 13.0% |
| Trinidadians and Tobagonians | 21.4 /100 | #201 | Fair 13.0% |
Demographics Similar to Ethiopians by Single Male Poverty
In terms of single male poverty, the demographic groups most similar to Ethiopians are Immigrants from Moldova (11.2%, a difference of 0.020%), Asian (11.2%, a difference of 0.34%), Immigrants from Bolivia (11.1%, a difference of 0.41%), Immigrants from Pakistan (11.2%, a difference of 0.44%), and Bolivian (11.2%, a difference of 0.65%).
| Demographics | Rating | Rank | Single Male Poverty |
| Immigrants | South Central Asia | 100.0 /100 | #13 | Exceptional 10.9% |
| Chinese | 100.0 /100 | #14 | Exceptional 11.0% |
| Koreans | 100.0 /100 | #15 | Exceptional 11.0% |
| Bhutanese | 100.0 /100 | #16 | Exceptional 11.1% |
| Tsimshian | 100.0 /100 | #17 | Exceptional 11.1% |
| Immigrants | Bolivia | 100.0 /100 | #18 | Exceptional 11.1% |
| Immigrants | Moldova | 100.0 /100 | #19 | Exceptional 11.2% |
| Ethiopians | 100.0 /100 | #20 | Exceptional 11.2% |
| Asians | 100.0 /100 | #21 | Exceptional 11.2% |
| Immigrants | Pakistan | 100.0 /100 | #22 | Exceptional 11.2% |
| Bolivians | 100.0 /100 | #23 | Exceptional 11.2% |
| Indians (Asian) | 100.0 /100 | #24 | Exceptional 11.3% |
| Maltese | 100.0 /100 | #25 | Exceptional 11.3% |
| Immigrants | Japan | 100.0 /100 | #26 | Exceptional 11.3% |
| Immigrants | China | 100.0 /100 | #27 | Exceptional 11.4% |