Liberian vs Ethiopian 4th Grade
COMPARE
Liberian
Ethiopian
4th Grade
4th Grade Comparison
Liberians
Ethiopians
97.2%
4TH GRADE
3.6/ 100
METRIC RATING
229th/ 347
METRIC RANK
97.1%
4TH GRADE
1.2/ 100
METRIC RATING
247th/ 347
METRIC RANK
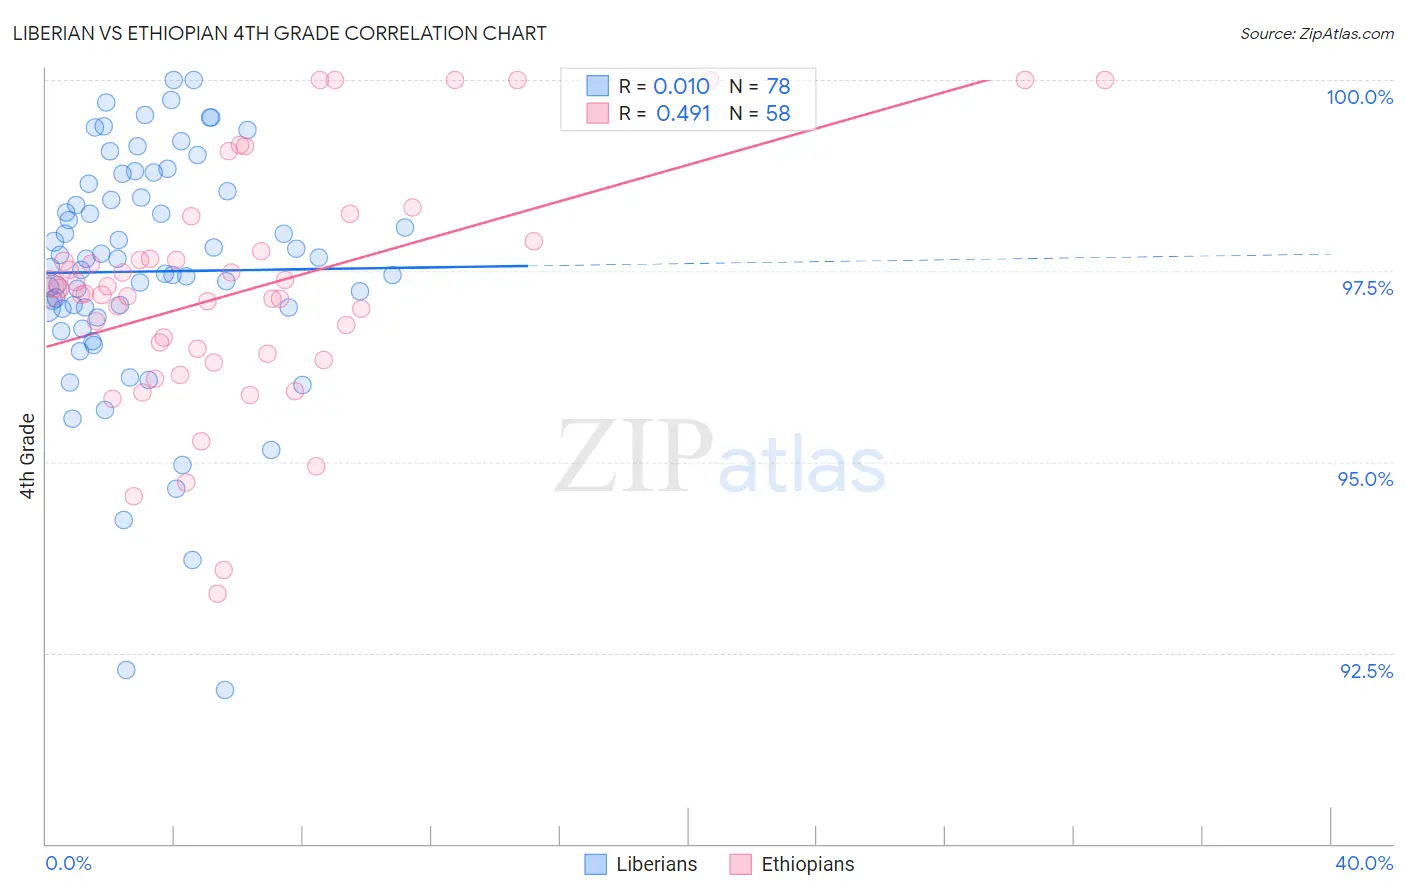
Liberian vs Ethiopian 4th Grade Correlation Chart
The statistical analysis conducted on geographies consisting of 118,098,536 people shows no correlation between the proportion of Liberians and percentage of population with at least 4th grade education in the United States with a correlation coefficient (R) of 0.010 and weighted average of 97.2%. Similarly, the statistical analysis conducted on geographies consisting of 223,120,541 people shows a moderate positive correlation between the proportion of Ethiopians and percentage of population with at least 4th grade education in the United States with a correlation coefficient (R) of 0.491 and weighted average of 97.1%, a difference of 0.11%.
4th Grade Correlation Summary
| Measurement | Liberian | Ethiopian |
| Minimum | 92.0% | 93.3% |
| Maximum | 100.0% | 100.0% |
| Range | 8.0% | 6.7% |
| Mean | 97.5% | 97.3% |
| Median | 97.6% | 97.2% |
| Interquartile 25% (IQ1) | 97.0% | 96.4% |
| Interquartile 75% (IQ3) | 98.5% | 97.8% |
| Interquartile Range (IQR) | 1.5% | 1.3% |
| Standard Deviation (Sample) | 1.6% | 1.5% |
| Standard Deviation (Population) | 1.6% | 1.5% |
Demographics Similar to Liberians and Ethiopians by 4th Grade
In terms of 4th grade, the demographic groups most similar to Liberians are Subsaharan African (97.2%, a difference of 0.0%), Uruguayan (97.2%, a difference of 0.0%), Immigrants from Malaysia (97.2%, a difference of 0.010%), Immigrants from Western Asia (97.2%, a difference of 0.010%), and Senegalese (97.2%, a difference of 0.010%). Similarly, the demographic groups most similar to Ethiopians are Korean (97.1%, a difference of 0.0%), Immigrants from Eastern Africa (97.1%, a difference of 0.0%), Immigrants from Uruguay (97.1%, a difference of 0.0%), Immigrants from Asia (97.1%, a difference of 0.0%), and Asian (97.1%, a difference of 0.010%).
| Demographics | Rating | Rank | 4th Grade |
| Sub-Saharan Africans | 3.6 /100 | #228 | Tragic 97.2% |
| Liberians | 3.6 /100 | #229 | Tragic 97.2% |
| Uruguayans | 3.5 /100 | #230 | Tragic 97.2% |
| Immigrants | Malaysia | 3.4 /100 | #231 | Tragic 97.2% |
| Immigrants | Western Asia | 3.4 /100 | #232 | Tragic 97.2% |
| Senegalese | 3.1 /100 | #233 | Tragic 97.2% |
| Assyrians/Chaldeans/Syriacs | 3.0 /100 | #234 | Tragic 97.2% |
| Yuman | 2.9 /100 | #235 | Tragic 97.2% |
| Immigrants | Eastern Asia | 2.7 /100 | #236 | Tragic 97.2% |
| Immigrants | Costa Rica | 2.0 /100 | #237 | Tragic 97.2% |
| Indians (Asian) | 1.9 /100 | #238 | Tragic 97.2% |
| Nigerians | 1.8 /100 | #239 | Tragic 97.1% |
| Colombians | 1.6 /100 | #240 | Tragic 97.1% |
| Immigrants | Indonesia | 1.5 /100 | #241 | Tragic 97.1% |
| Asians | 1.4 /100 | #242 | Tragic 97.1% |
| U.S. Virgin Islanders | 1.4 /100 | #243 | Tragic 97.1% |
| Koreans | 1.3 /100 | #244 | Tragic 97.1% |
| Immigrants | Eastern Africa | 1.2 /100 | #245 | Tragic 97.1% |
| Immigrants | Uruguay | 1.2 /100 | #246 | Tragic 97.1% |
| Ethiopians | 1.2 /100 | #247 | Tragic 97.1% |
| Immigrants | Asia | 1.2 /100 | #248 | Tragic 97.1% |