Liberian vs Iranian Associate's Degree
COMPARE
Liberian
Iranian
Associate's Degree
Associate's Degree Comparison
Liberians
Iranians
43.3%
ASSOCIATE'S DEGREE
2.9/ 100
METRIC RATING
231st/ 347
METRIC RANK
58.2%
ASSOCIATE'S DEGREE
100.0/ 100
METRIC RATING
5th/ 347
METRIC RANK
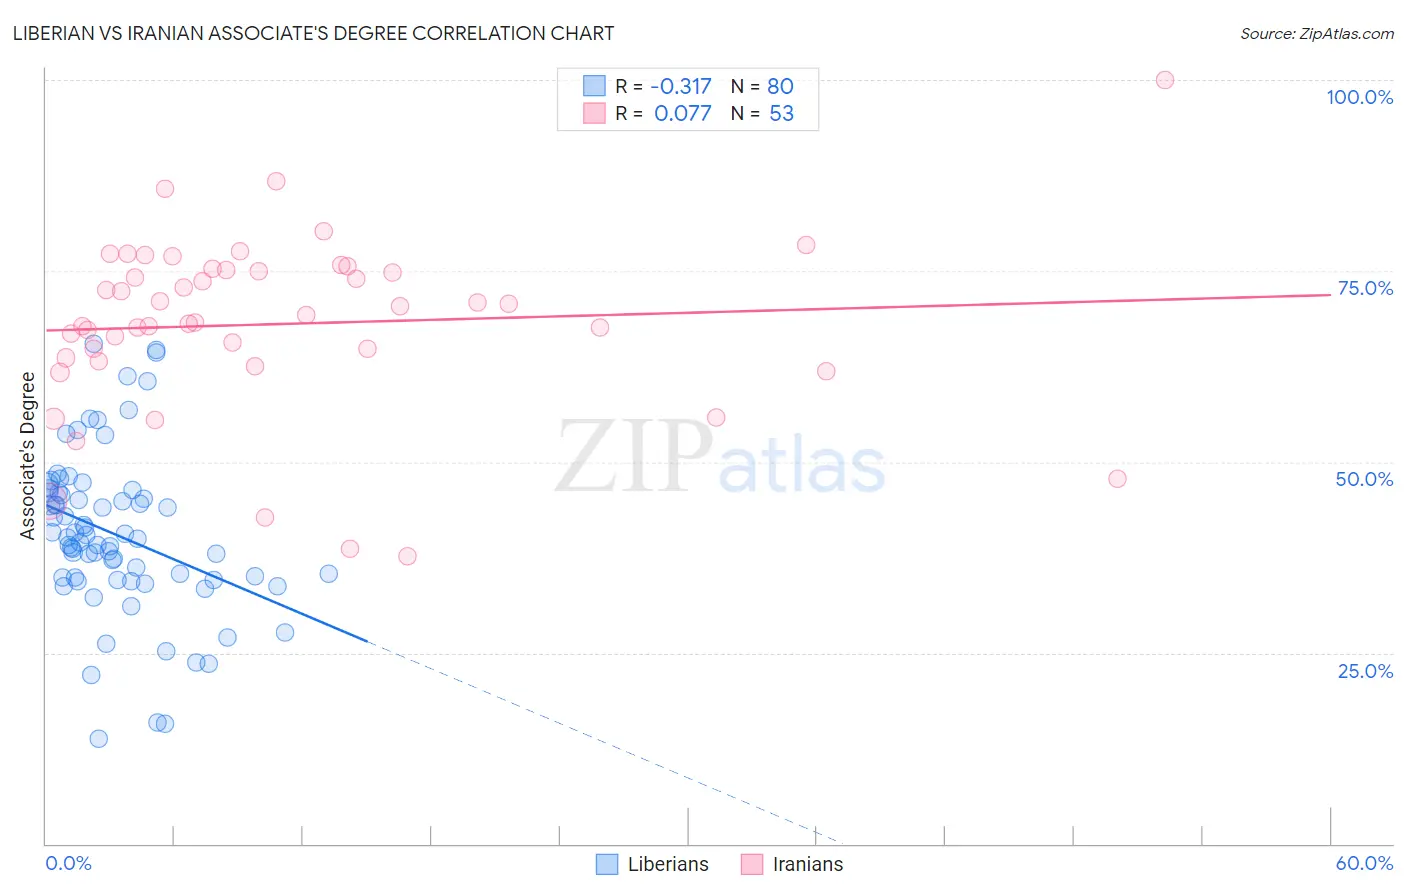
Liberian vs Iranian Associate's Degree Correlation Chart
The statistical analysis conducted on geographies consisting of 118,102,624 people shows a mild negative correlation between the proportion of Liberians and percentage of population with at least associate's degree education in the United States with a correlation coefficient (R) of -0.317 and weighted average of 43.3%. Similarly, the statistical analysis conducted on geographies consisting of 316,879,465 people shows a slight positive correlation between the proportion of Iranians and percentage of population with at least associate's degree education in the United States with a correlation coefficient (R) of 0.077 and weighted average of 58.2%, a difference of 34.3%.
Associate's Degree Correlation Summary
| Measurement | Liberian | Iranian |
| Minimum | 13.8% | 37.7% |
| Maximum | 65.5% | 100.0% |
| Range | 51.7% | 62.3% |
| Mean | 40.5% | 68.1% |
| Median | 39.9% | 69.2% |
| Interquartile 25% (IQ1) | 34.7% | 63.4% |
| Interquartile 75% (IQ3) | 45.9% | 75.2% |
| Interquartile Range (IQR) | 11.3% | 11.8% |
| Standard Deviation (Sample) | 10.6% | 11.7% |
| Standard Deviation (Population) | 10.5% | 11.6% |
Similar Demographics by Associate's Degree
Demographics Similar to Liberians by Associate's Degree
In terms of associate's degree, the demographic groups most similar to Liberians are Immigrants from Barbados (43.3%, a difference of 0.010%), Immigrants from Trinidad and Tobago (43.3%, a difference of 0.080%), Hmong (43.4%, a difference of 0.23%), Native Hawaiian (43.1%, a difference of 0.43%), and Tongan (43.0%, a difference of 0.59%).
| Demographics | Rating | Rank | Associate's Degree |
| West Indians | 5.2 /100 | #224 | Tragic 43.8% |
| Guamanians/Chamorros | 4.8 /100 | #225 | Tragic 43.8% |
| Immigrants | Burma/Myanmar | 4.3 /100 | #226 | Tragic 43.7% |
| Trinidadians and Tobagonians | 4.0 /100 | #227 | Tragic 43.6% |
| Hmong | 3.2 /100 | #228 | Tragic 43.4% |
| Immigrants | Trinidad and Tobago | 3.0 /100 | #229 | Tragic 43.3% |
| Immigrants | Barbados | 2.9 /100 | #230 | Tragic 43.3% |
| Liberians | 2.9 /100 | #231 | Tragic 43.3% |
| Native Hawaiians | 2.3 /100 | #232 | Tragic 43.1% |
| Tongans | 2.2 /100 | #233 | Tragic 43.0% |
| Tlingit-Haida | 2.1 /100 | #234 | Tragic 43.0% |
| Ecuadorians | 2.0 /100 | #235 | Tragic 43.0% |
| Immigrants | St. Vincent and the Grenadines | 1.9 /100 | #236 | Tragic 42.9% |
| Immigrants | Nonimmigrants | 1.9 /100 | #237 | Tragic 42.9% |
| Iroquois | 1.7 /100 | #238 | Tragic 42.8% |
Demographics Similar to Iranians by Associate's Degree
In terms of associate's degree, the demographic groups most similar to Iranians are Immigrants from Taiwan (58.4%, a difference of 0.41%), Immigrants from India (58.5%, a difference of 0.66%), Okinawan (57.7%, a difference of 0.83%), Immigrants from Iran (57.7%, a difference of 0.89%), and Thai (57.4%, a difference of 1.3%).
| Demographics | Rating | Rank | Associate's Degree |
| Filipinos | 100.0 /100 | #1 | Exceptional 59.8% |
| Immigrants | Singapore | 100.0 /100 | #2 | Exceptional 58.9% |
| Immigrants | India | 100.0 /100 | #3 | Exceptional 58.5% |
| Immigrants | Taiwan | 100.0 /100 | #4 | Exceptional 58.4% |
| Iranians | 100.0 /100 | #5 | Exceptional 58.2% |
| Okinawans | 100.0 /100 | #6 | Exceptional 57.7% |
| Immigrants | Iran | 100.0 /100 | #7 | Exceptional 57.7% |
| Thais | 100.0 /100 | #8 | Exceptional 57.4% |
| Immigrants | Israel | 100.0 /100 | #9 | Exceptional 56.8% |
| Cypriots | 100.0 /100 | #10 | Exceptional 56.4% |
| Immigrants | Australia | 100.0 /100 | #11 | Exceptional 55.8% |
| Immigrants | South Central Asia | 100.0 /100 | #12 | Exceptional 55.7% |
| Immigrants | China | 100.0 /100 | #13 | Exceptional 55.5% |
| Immigrants | Hong Kong | 100.0 /100 | #14 | Exceptional 55.4% |
| Immigrants | Eastern Asia | 100.0 /100 | #15 | Exceptional 55.4% |