Liberian vs Serbian Associate's Degree
COMPARE
Liberian
Serbian
Associate's Degree
Associate's Degree Comparison
Liberians
Serbians
43.3%
ASSOCIATE'S DEGREE
2.9/ 100
METRIC RATING
231st/ 347
METRIC RANK
48.5%
ASSOCIATE'S DEGREE
92.6/ 100
METRIC RATING
124th/ 347
METRIC RANK
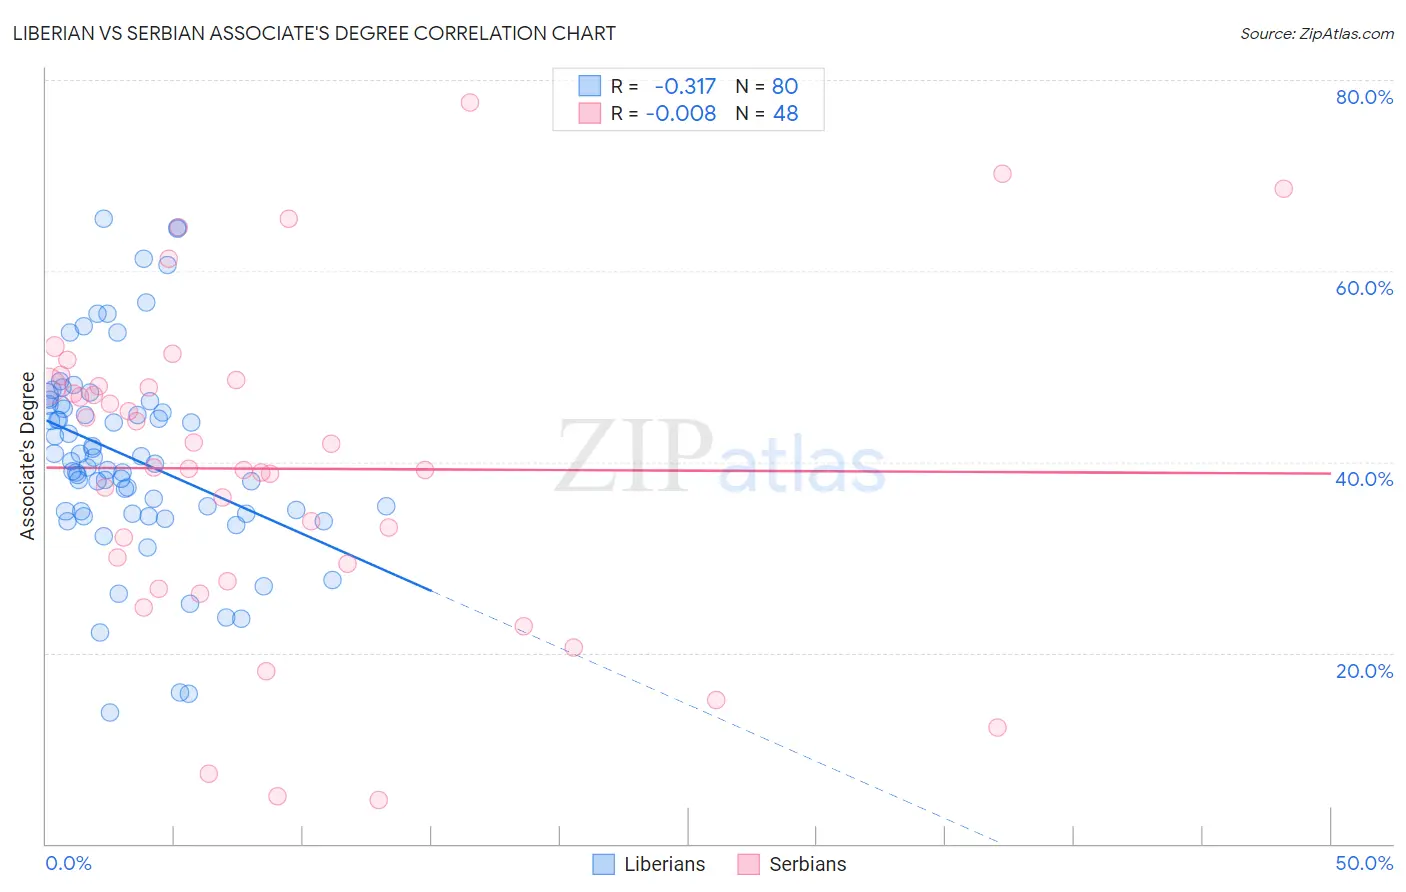
Liberian vs Serbian Associate's Degree Correlation Chart
The statistical analysis conducted on geographies consisting of 118,102,624 people shows a mild negative correlation between the proportion of Liberians and percentage of population with at least associate's degree education in the United States with a correlation coefficient (R) of -0.317 and weighted average of 43.3%. Similarly, the statistical analysis conducted on geographies consisting of 267,638,366 people shows no correlation between the proportion of Serbians and percentage of population with at least associate's degree education in the United States with a correlation coefficient (R) of -0.008 and weighted average of 48.5%, a difference of 12.1%.
Associate's Degree Correlation Summary
| Measurement | Liberian | Serbian |
| Minimum | 13.8% | 4.6% |
| Maximum | 65.5% | 77.6% |
| Range | 51.7% | 73.0% |
| Mean | 40.5% | 39.3% |
| Median | 39.9% | 39.3% |
| Interquartile 25% (IQ1) | 34.7% | 28.5% |
| Interquartile 75% (IQ3) | 45.9% | 47.9% |
| Interquartile Range (IQR) | 11.3% | 19.5% |
| Standard Deviation (Sample) | 10.6% | 16.7% |
| Standard Deviation (Population) | 10.5% | 16.5% |
Similar Demographics by Associate's Degree
Demographics Similar to Liberians by Associate's Degree
In terms of associate's degree, the demographic groups most similar to Liberians are Immigrants from Barbados (43.3%, a difference of 0.010%), Immigrants from Trinidad and Tobago (43.3%, a difference of 0.080%), Hmong (43.4%, a difference of 0.23%), Native Hawaiian (43.1%, a difference of 0.43%), and Tongan (43.0%, a difference of 0.59%).
| Demographics | Rating | Rank | Associate's Degree |
| West Indians | 5.2 /100 | #224 | Tragic 43.8% |
| Guamanians/Chamorros | 4.8 /100 | #225 | Tragic 43.8% |
| Immigrants | Burma/Myanmar | 4.3 /100 | #226 | Tragic 43.7% |
| Trinidadians and Tobagonians | 4.0 /100 | #227 | Tragic 43.6% |
| Hmong | 3.2 /100 | #228 | Tragic 43.4% |
| Immigrants | Trinidad and Tobago | 3.0 /100 | #229 | Tragic 43.3% |
| Immigrants | Barbados | 2.9 /100 | #230 | Tragic 43.3% |
| Liberians | 2.9 /100 | #231 | Tragic 43.3% |
| Native Hawaiians | 2.3 /100 | #232 | Tragic 43.1% |
| Tongans | 2.2 /100 | #233 | Tragic 43.0% |
| Tlingit-Haida | 2.1 /100 | #234 | Tragic 43.0% |
| Ecuadorians | 2.0 /100 | #235 | Tragic 43.0% |
| Immigrants | St. Vincent and the Grenadines | 1.9 /100 | #236 | Tragic 42.9% |
| Immigrants | Nonimmigrants | 1.9 /100 | #237 | Tragic 42.9% |
| Iroquois | 1.7 /100 | #238 | Tragic 42.8% |
Demographics Similar to Serbians by Associate's Degree
In terms of associate's degree, the demographic groups most similar to Serbians are Chinese (48.5%, a difference of 0.020%), Immigrants from Syria (48.5%, a difference of 0.10%), Immigrants from Uganda (48.5%, a difference of 0.12%), Immigrants from Eastern Africa (48.4%, a difference of 0.23%), and Swedish (48.4%, a difference of 0.27%).
| Demographics | Rating | Rank | Associate's Degree |
| Afghans | 94.8 /100 | #117 | Exceptional 48.9% |
| Albanians | 94.7 /100 | #118 | Exceptional 48.8% |
| Lebanese | 94.6 /100 | #119 | Exceptional 48.8% |
| Alsatians | 94.6 /100 | #120 | Exceptional 48.8% |
| Ugandans | 93.9 /100 | #121 | Exceptional 48.7% |
| Italians | 93.9 /100 | #122 | Exceptional 48.7% |
| Brazilians | 93.7 /100 | #123 | Exceptional 48.7% |
| Serbians | 92.6 /100 | #124 | Exceptional 48.5% |
| Chinese | 92.5 /100 | #125 | Exceptional 48.5% |
| Immigrants | Syria | 92.2 /100 | #126 | Exceptional 48.5% |
| Immigrants | Uganda | 92.1 /100 | #127 | Exceptional 48.5% |
| Immigrants | Eastern Africa | 91.6 /100 | #128 | Exceptional 48.4% |
| Swedes | 91.5 /100 | #129 | Exceptional 48.4% |
| Immigrants | Jordan | 91.2 /100 | #130 | Exceptional 48.4% |
| Icelanders | 90.8 /100 | #131 | Exceptional 48.3% |